
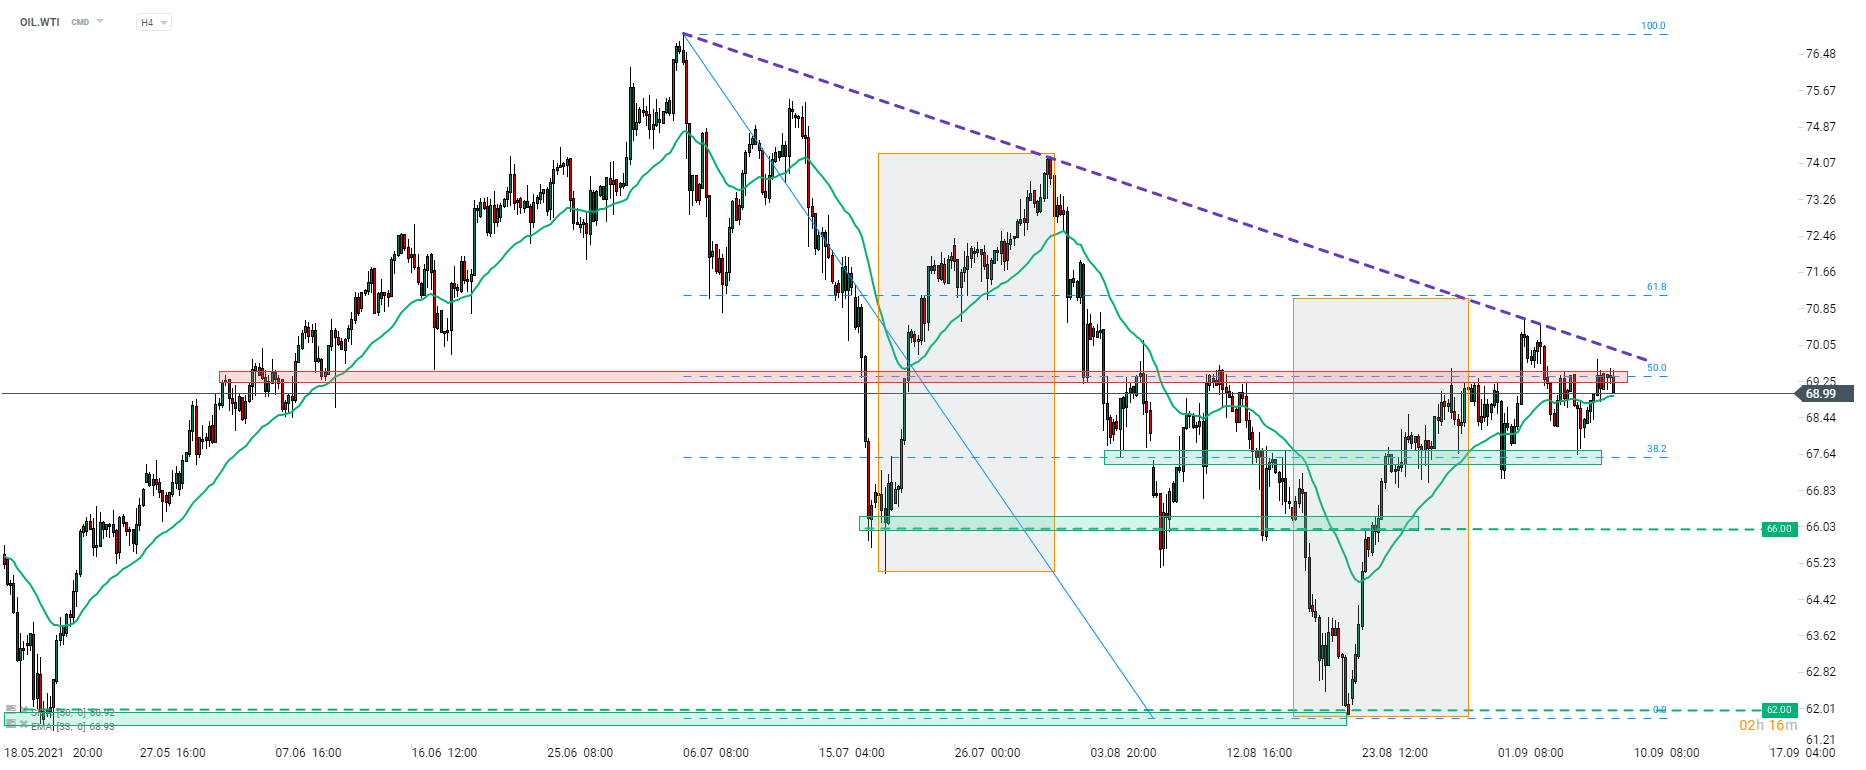
Upward correction on OIL.WTI was halted at the downward trendline last week. Price pulled back later on but bulls managed to find support at the zone ranging around 38.2% retracement of the downward impulse launched in early-July ($67.60 area). Subsequent upward move pushed the price towards the 50% retracement at around $69.60. A pullback from this area can be observed at press time and given no major near-term catalysts, OIL.WTI may be set to trade in a range marked with 38.2 and 50% retracements. Oil manages to more or less hold its ground amid big sell-off on the equity markets with ranges of moves being much smaller. Yesterday's API report singalled a smaller-than-expected draw in oil inventories and traders will look for confirmation in today's DOE report (4:00 pm BST). However, DOE reports failed to trigger big price moves recently and the situation may repeat today. If this is the case, traders should wait for a break above the 50% retracement or below the 38.2% retracement in order to determine the direction of the next big move. Break above the 50% retracement and a downward trendline that lies slightly above may hint at a trend reversal.
 Source: xStation5

Daily Summary - The market starts to doubt rate hikes after Warsh, but Trump destroys the rebound

Strong Sell-off in Coffee and Cocoa

⚫Massive Drop in US Oil Inventories Further Fuels Prices
🟡Gold tests $4000 ahead of the Fed decision