
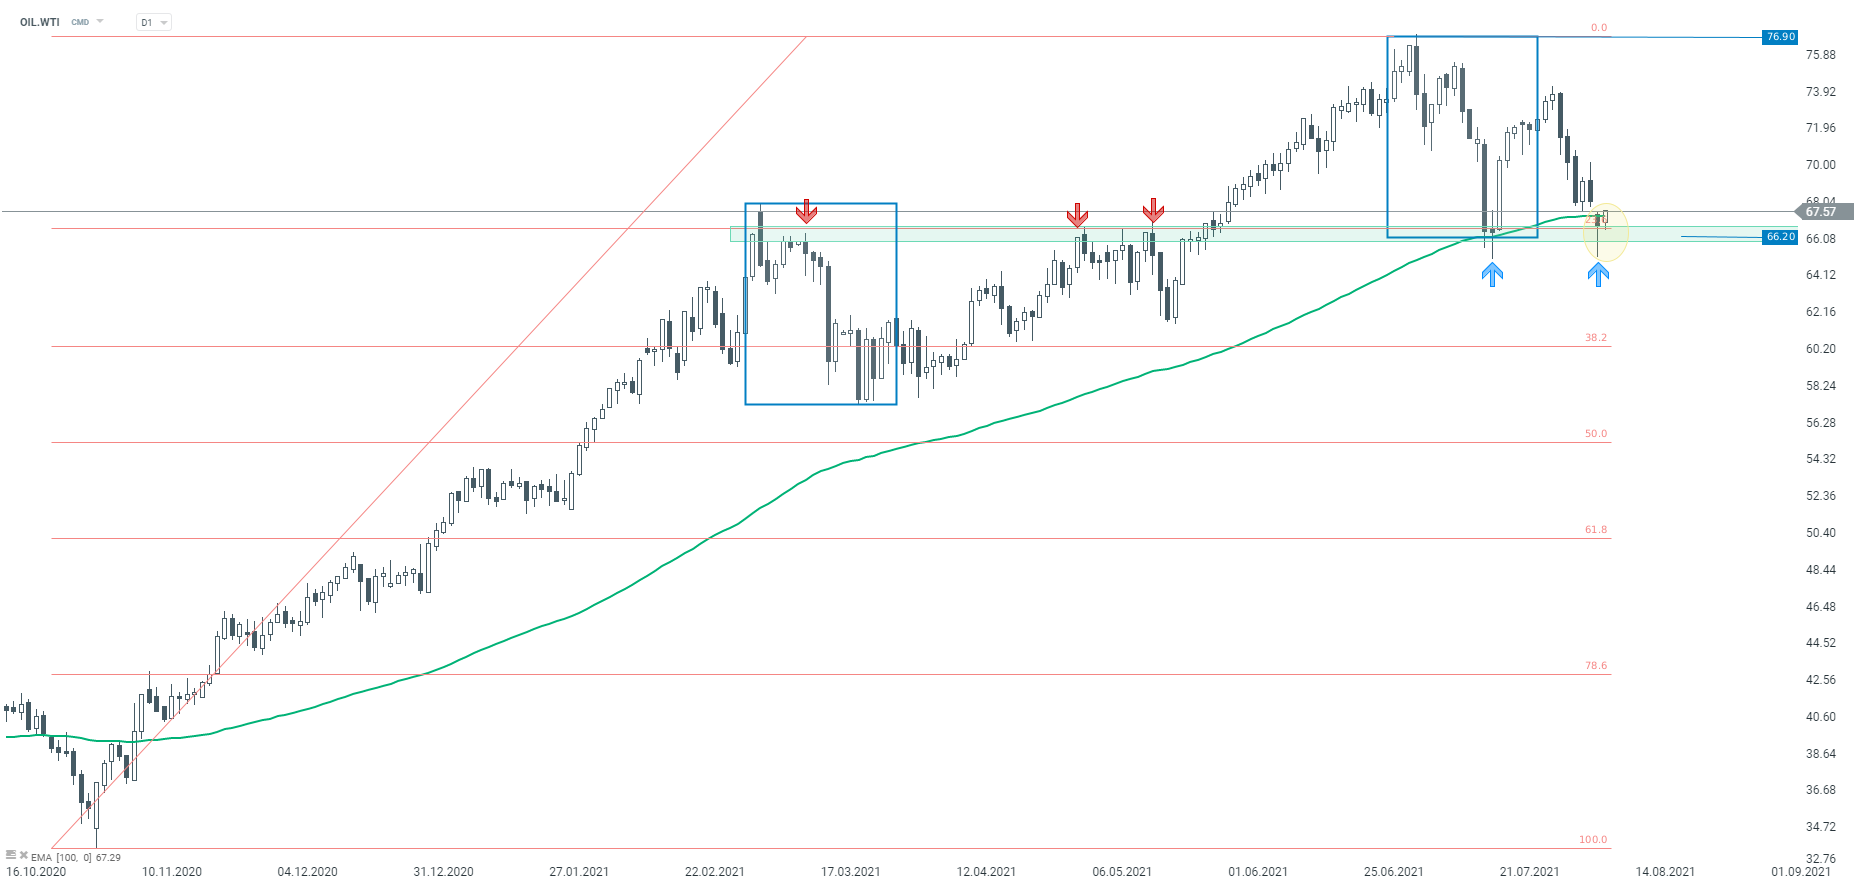
Oil prices found themselves under pressure yesterday and experienced a steep sell-off. WTI was trading down over 4% at one point of the session and was testing lows from July 2021 near $65.10. However, bulls managed to bounce off the daily lows and OIL.WTI climbed back above the price zone ranging around $66.20 mark. This zone is marked with previous price reactions, 100-session EMA, 23.6% retracement as well as the lower limit of the Overbalance. On top of that, yesterday's daily candlestick took a pin bar pattern signalling a strong technical case for recovery. There are three events this week that may trigger a jump in short-term volatility on the oil market - API report (today, 9:40 pm BST), DOE report (tomorrow, 3:30 pm BST) and OPEC monthly report (Thursday, around noon).
 Source: xStation5

Daily Summary: Chip War Weighs on Wall Street as Oil Plunges After US–Iran Ceasefire ⭐

🔴European TTF gas prices fall by 7.5%

Morning Wrap: The weekend slump in oil prices is accelerating 💥 (27.07.2026)

When will the rise in oil prices reach us?