



WTI crude (OIL.WTI) is approaching $71 barrel which is the lowest level since mid June, and on course for 4% weekly loss, the most since mid-March, as oversupply concerns regarding compromise between UAE and Saudi Arabia still weigh on market sentiment. Additionally, news that Goldman Sachs lowered its second-half growth forecasts by an average of 1.8 % across Southeast Asia, due to spread of Delta variant and rise in US gasoline inventories in a week that included the Fourth of July holiday, when driving usually surges, raised fresh demand concerns. From a technical point of view, the price broke below 200 SMA (red line) and is heading towards support at $69.00 which is marked with the lower limit of the 1:1 structure and lower limit of the downward channel.
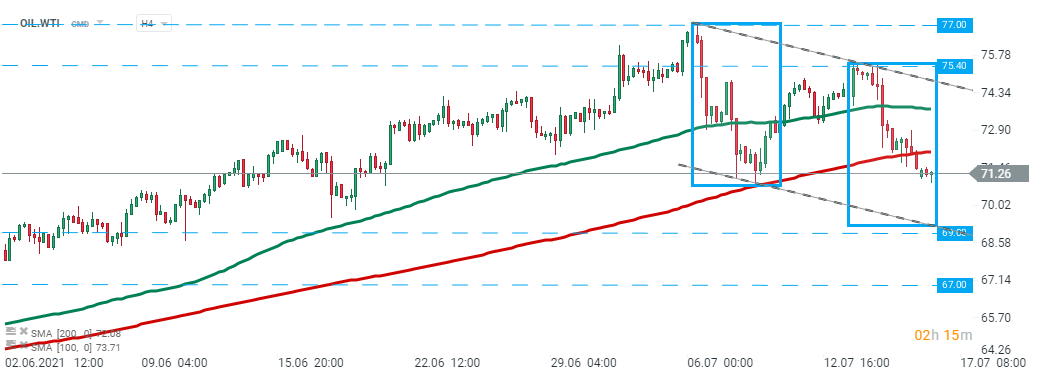 Source:xStation5



Daily Summary: Friday offers no relief; the US100 drops 2%🚨


Three Markets to Watch Next Week (October 16, 2026)


Chart of the Day: NATGAS - Are there chances for a seasonal rebound amid warm weather?


Morning Briefing: Warsh's silence on interest rates. AI debt fears cooled sentiment, but a rebound is visible