
Although Joe Biden and Xi Jinping had a general discussion on a broad range of topics and the phone call was not meant to lead to any agreement or declaration, risk sentiment improved. Stocks in Asia gained, indices from Europe are trading slightly higher and US futures advance.
Nasdaq-100 (US100) managed to find support at the lower limit of local market geometry (15,550 pts), which is additionally strengthened by the 38.2% retracement of the upward impulse launched at the end of August. Positive reaction to this important support signals that the uptrend is not over yet. The index recovered and is currently testing a resistance zone at 15,605pts, marked with 50-hour moving average (green line), 23.6% retracement and previous price reactions. The next resistance to watch in case of a break above is 100-hour moving average (red line) at 15,640 pts.
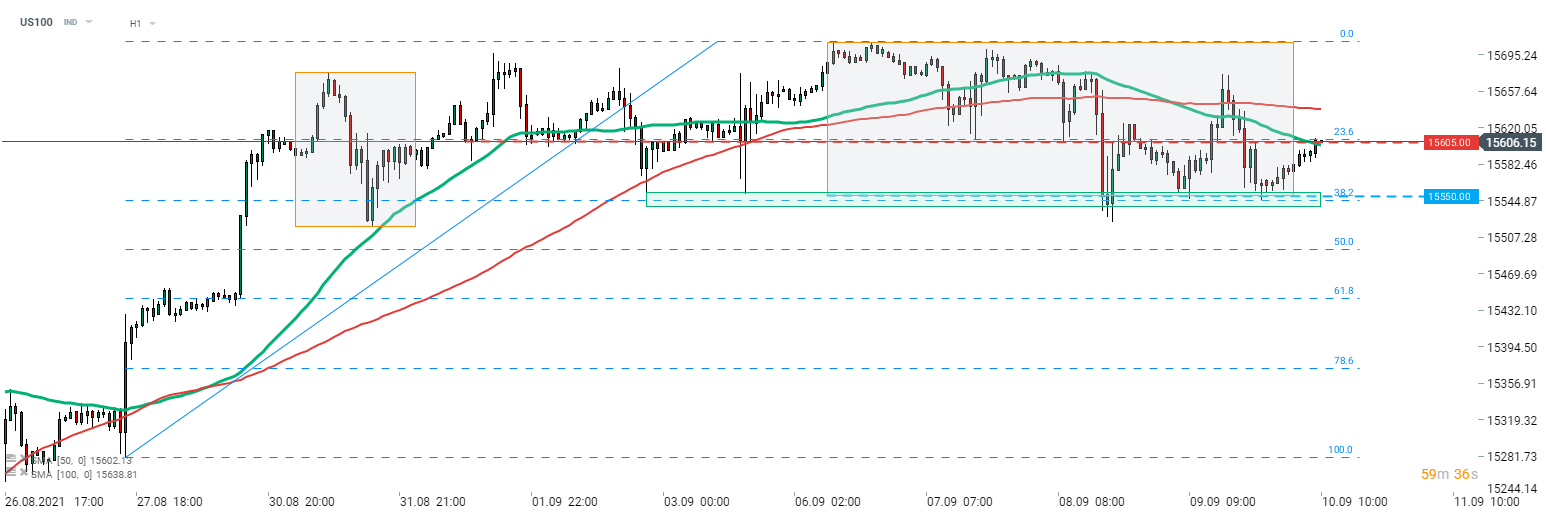 Source: xStation5

Daily Summary: Wall Street Regains Ground; Another Intervention in the Yen Market❓

Three Markets to Watch Next Week (July 31, 2026)

Market Wrap: European equities at 3-week highs! Apple dips in US premarket!

Economic Calendar: Key European CPI Readings and Oil Giants’ Earnings