
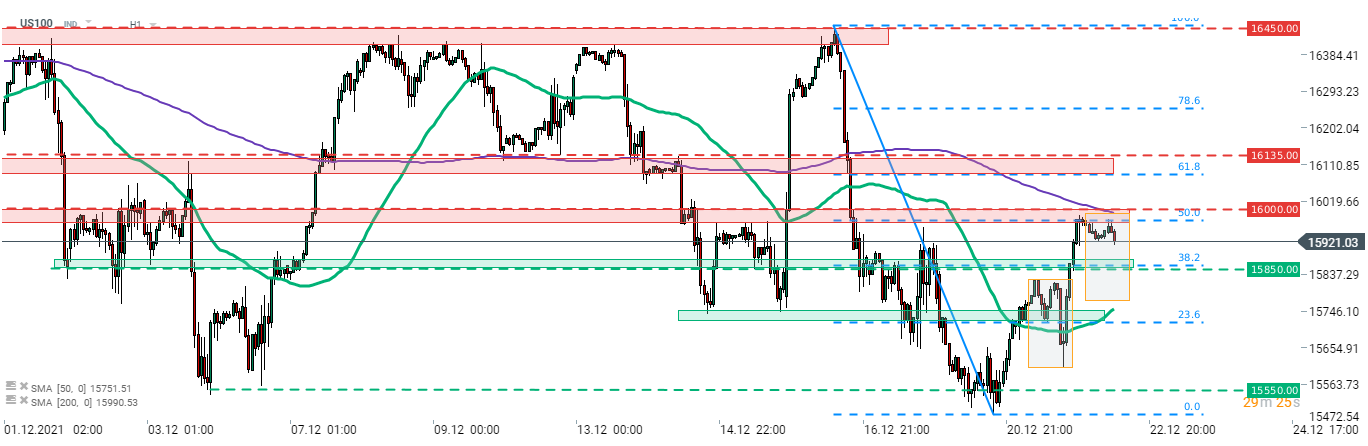
Wall Street indices managed to snap a losing streak yesterday and finished trading higher. Nasdaq-100 (US100) was one of the top performers gaining 2.3%. Tech index bounced off the lows from December 3 (15,550 pts)at the beginning of this week and launched a recovery move. A double bottom pattern surfaced on the chart and 16,400-16,450 pts area can be treated as the neckline. Breaking above could trigger a 900-points upward move (textbook range of the breakout from the pattern). However, the recovery move was halted at the resistance zone marked with 50% retracement of a recent drop, 200-hour moving average (purple line) and psychological 16,000 pts level. Index is pulling back at press time and if declines deepen, a test of the near-term support at 38.2% retracement cannot be ruled out (15,850 pts area).
 Source: xStation5

Daily Summary: Markets limit the pullback while awaiting the Fed

The semiconductors sell-off continues 📉

US OPEN: Deeper sell-off and a SaaS rebound

Daily Summary: Chip War Weighs on Wall Street as Oil Plunges After US–Iran Ceasefire ⭐