
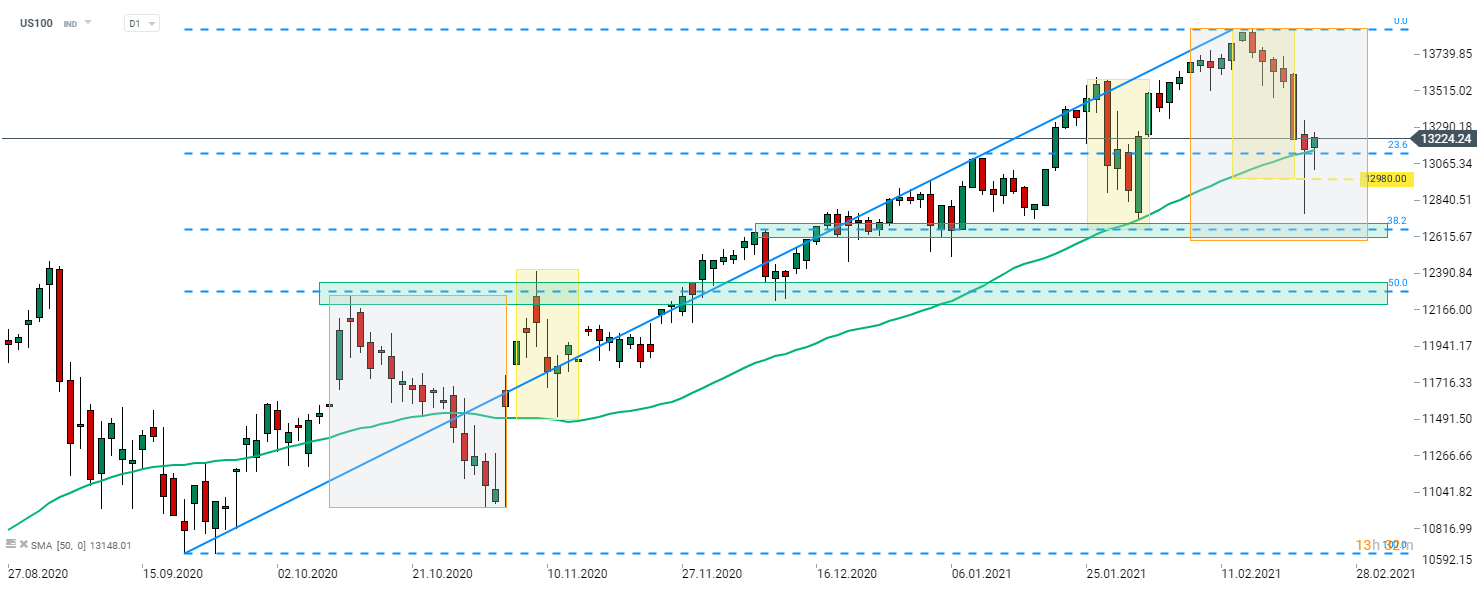
Global equity markets plunged over the past two days amid sell-off in tech shares. Combined with previous week decline, US100 moved around 5% off the all-time highs. Index found support at the 50-session moving average (green line) and the 23.6% retracement of the upward move started in September 2020 yesterday and is trying to recover today. As long as price stays above the lower limit of local market geometry at 12,980 pts, an ongoing plunge can be viewed as a correction. In case a break below 12,980 pts occurs, a way towards the lower limit of the large Overbalance structure and a support at 38.2% retracement (12,650 pts) would be left open.
 Source: xStation5

Daily Summary: Wall Street Regains Ground; Another Intervention in the Yen Market❓

Three Markets to Watch Next Week (July 31, 2026)

Market Wrap: European equities at 3-week highs! Apple dips in US premarket!

Economic Calendar: Key European CPI Readings and Oil Giants’ Earnings