



US2000 approaches its all-time high as investors await announcements from the conclusion of the Federal Reserve’s 2-day policy meeting. From a technical point of view, the index approaches the upper limit of the consolidation zone which started in February 2021. Recently, we could observe a strong uptrend, which means that there is a possibility that the index may leave the consolidation zone. If today's session ends above the 2,360 pts level, it is possible that the index will resume the main uptrend. In this case, next resistance levels can be found at Fibonacci external retracements - 127.2% and 161.8%.
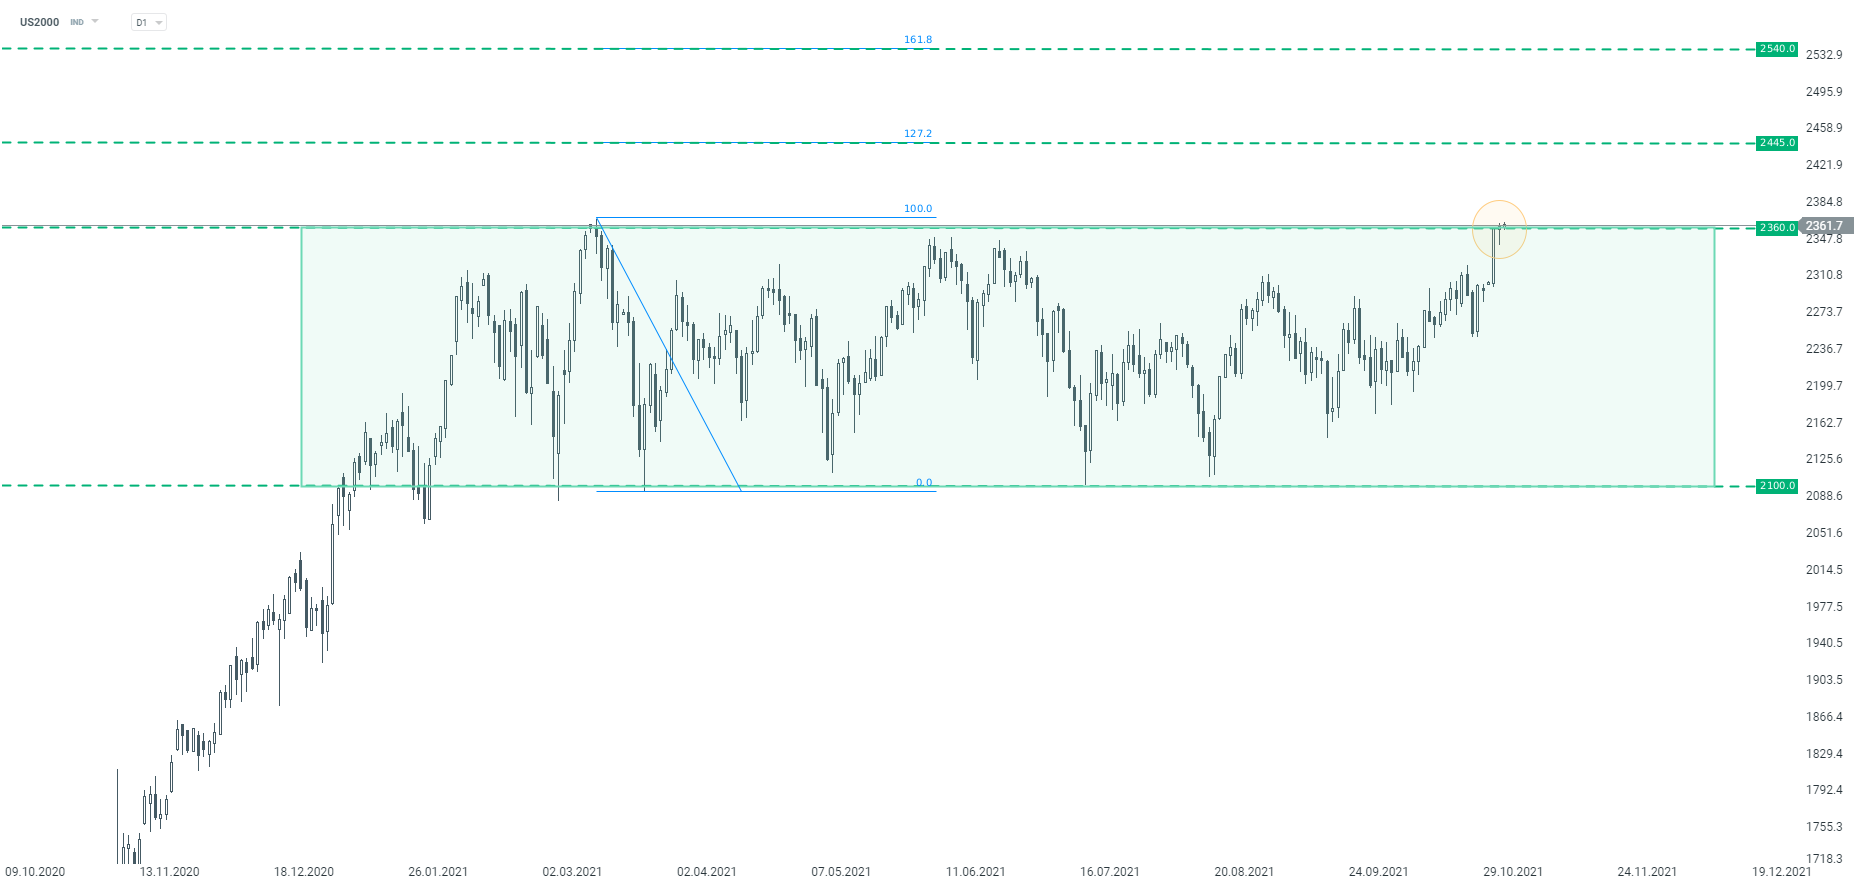 US2000 interval D1. Source: xStation5


What's next for the S&P 500? 🗽 U.S. Earnings Season Summary



📊Morning Wrap: Oil falls after Qatar talks. China injects liquidity, while the US prepares for elections.


💥Daily Summary: Tech Sector Crash on Wall Street and Historic Attack on Binance


🔴Three Markets to Watch Next Week: US500, BITCOIN, EURUSD (30.10.2026)