
Russia-Ukraine tensions continue to be the main driver of moves in the markets. US indices took a hit yesterday as Western officials insisted that there is no evidence of Russian troop withdrawal from the border and that risk of imminent invasion remains high. An important thing to consider while trading US equities today is that there is a long weekend ahead. United States will observe Presidents' Day on Monday and as such there will be no session on Wall Street. This, in turn, may encourage some investors to reduce risk exposure amid high tensions in Europe in order not to remain long risk during the long weekend.
Taking a look at US2000 chart at D1 interval, we can see that the index has reached the upper limit of the local market geometry this week. This technical hurdle also serves as the lower limit of a 2,080-2,100 pts resistance zone. From a technical point of view, this could be a make or break moment for the index. A break above the aforementioned resistance zone could hint that short-term trend reversed upward and a recovery move is looming. On the other hand, should we see further weakness during US session today and the index pulls back from the resistance, another leg lower will become a base case scenario.
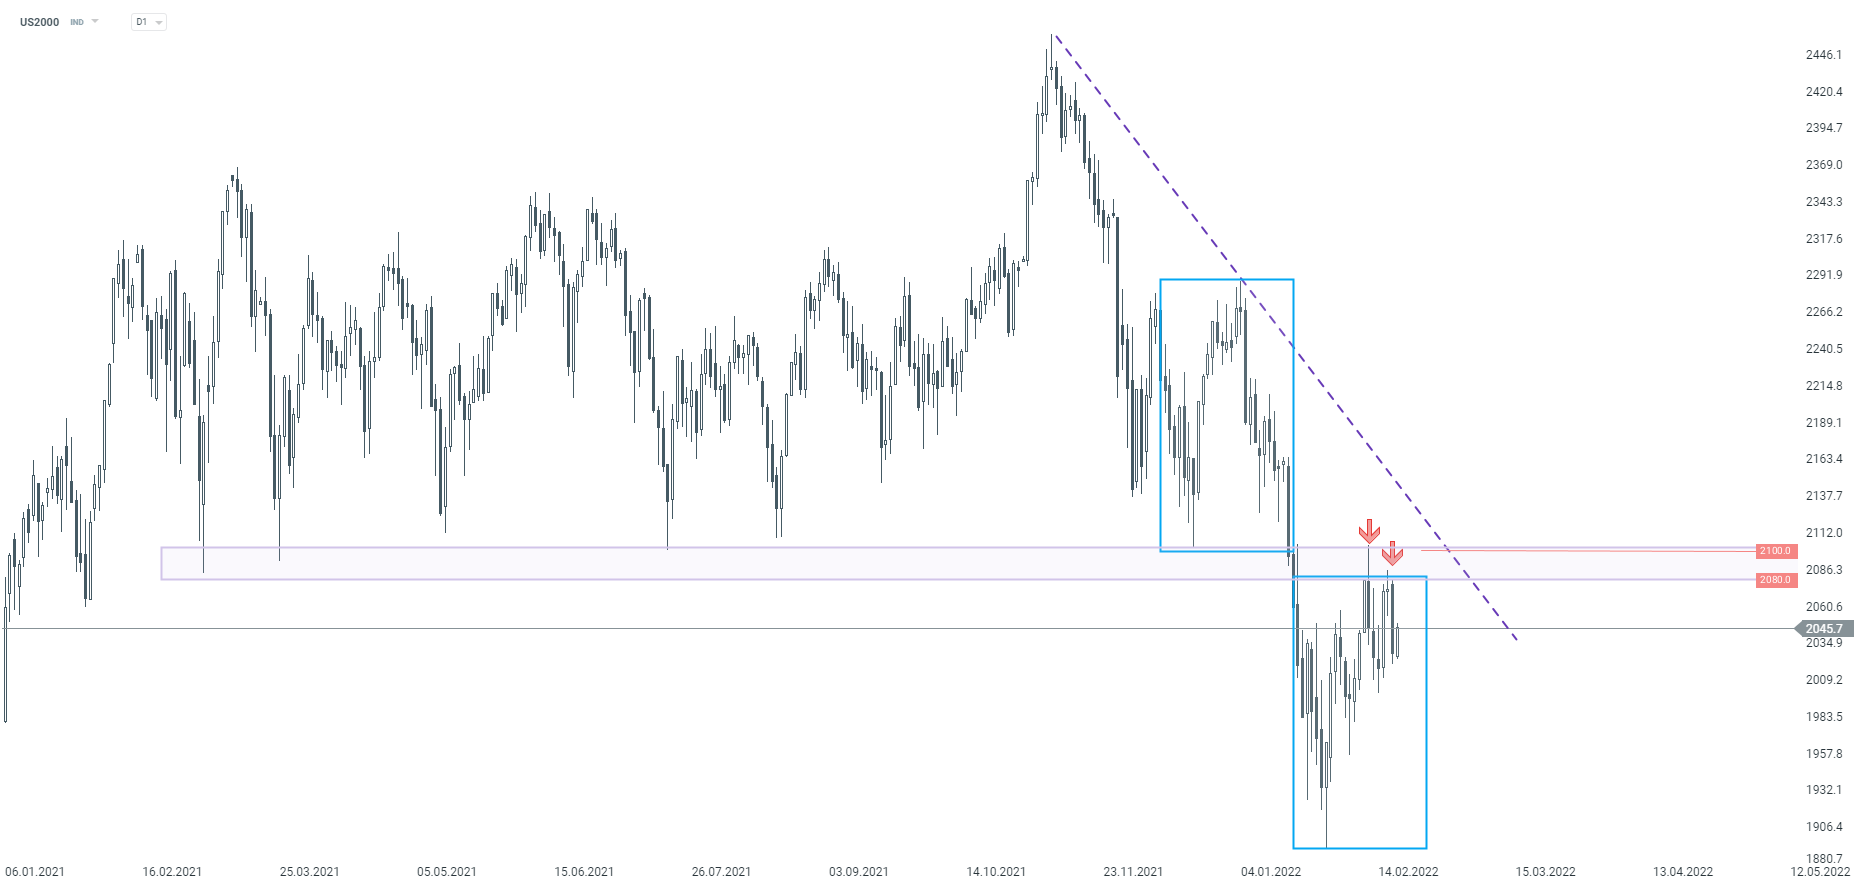 Source: xStation5

Daily Summary: Equities rally on not-so-hawkish Fed and AI trade revival, Yen dominates FX, oil retreats (30.07.2026)

Nasdaq futures rally more than 3% 🚀

US OPEN: Nasdaq rebounds! Microsoft and Lam Research earnings revive AI trade!

Daily Summary - The market starts to doubt rate hikes after Warsh, but Trump destroys the rebound