
S&P 500 futures (US500) are trading a touch higher today, after snapping a 7-day winning streak on Friday. US500 closed daily candlestick lower on Friday for the first time since December 6, 2023. Pause in rally was triggered by comments from Fed members, especially Fed Williams, who said that it is premature to think about rate cuts at this point. A strong dovish rally (equities and gold up, USD down) was seen in the markets after last week's FOMC decision, and it looks like Fed officials tried to cool market expectations in their recent remarks.
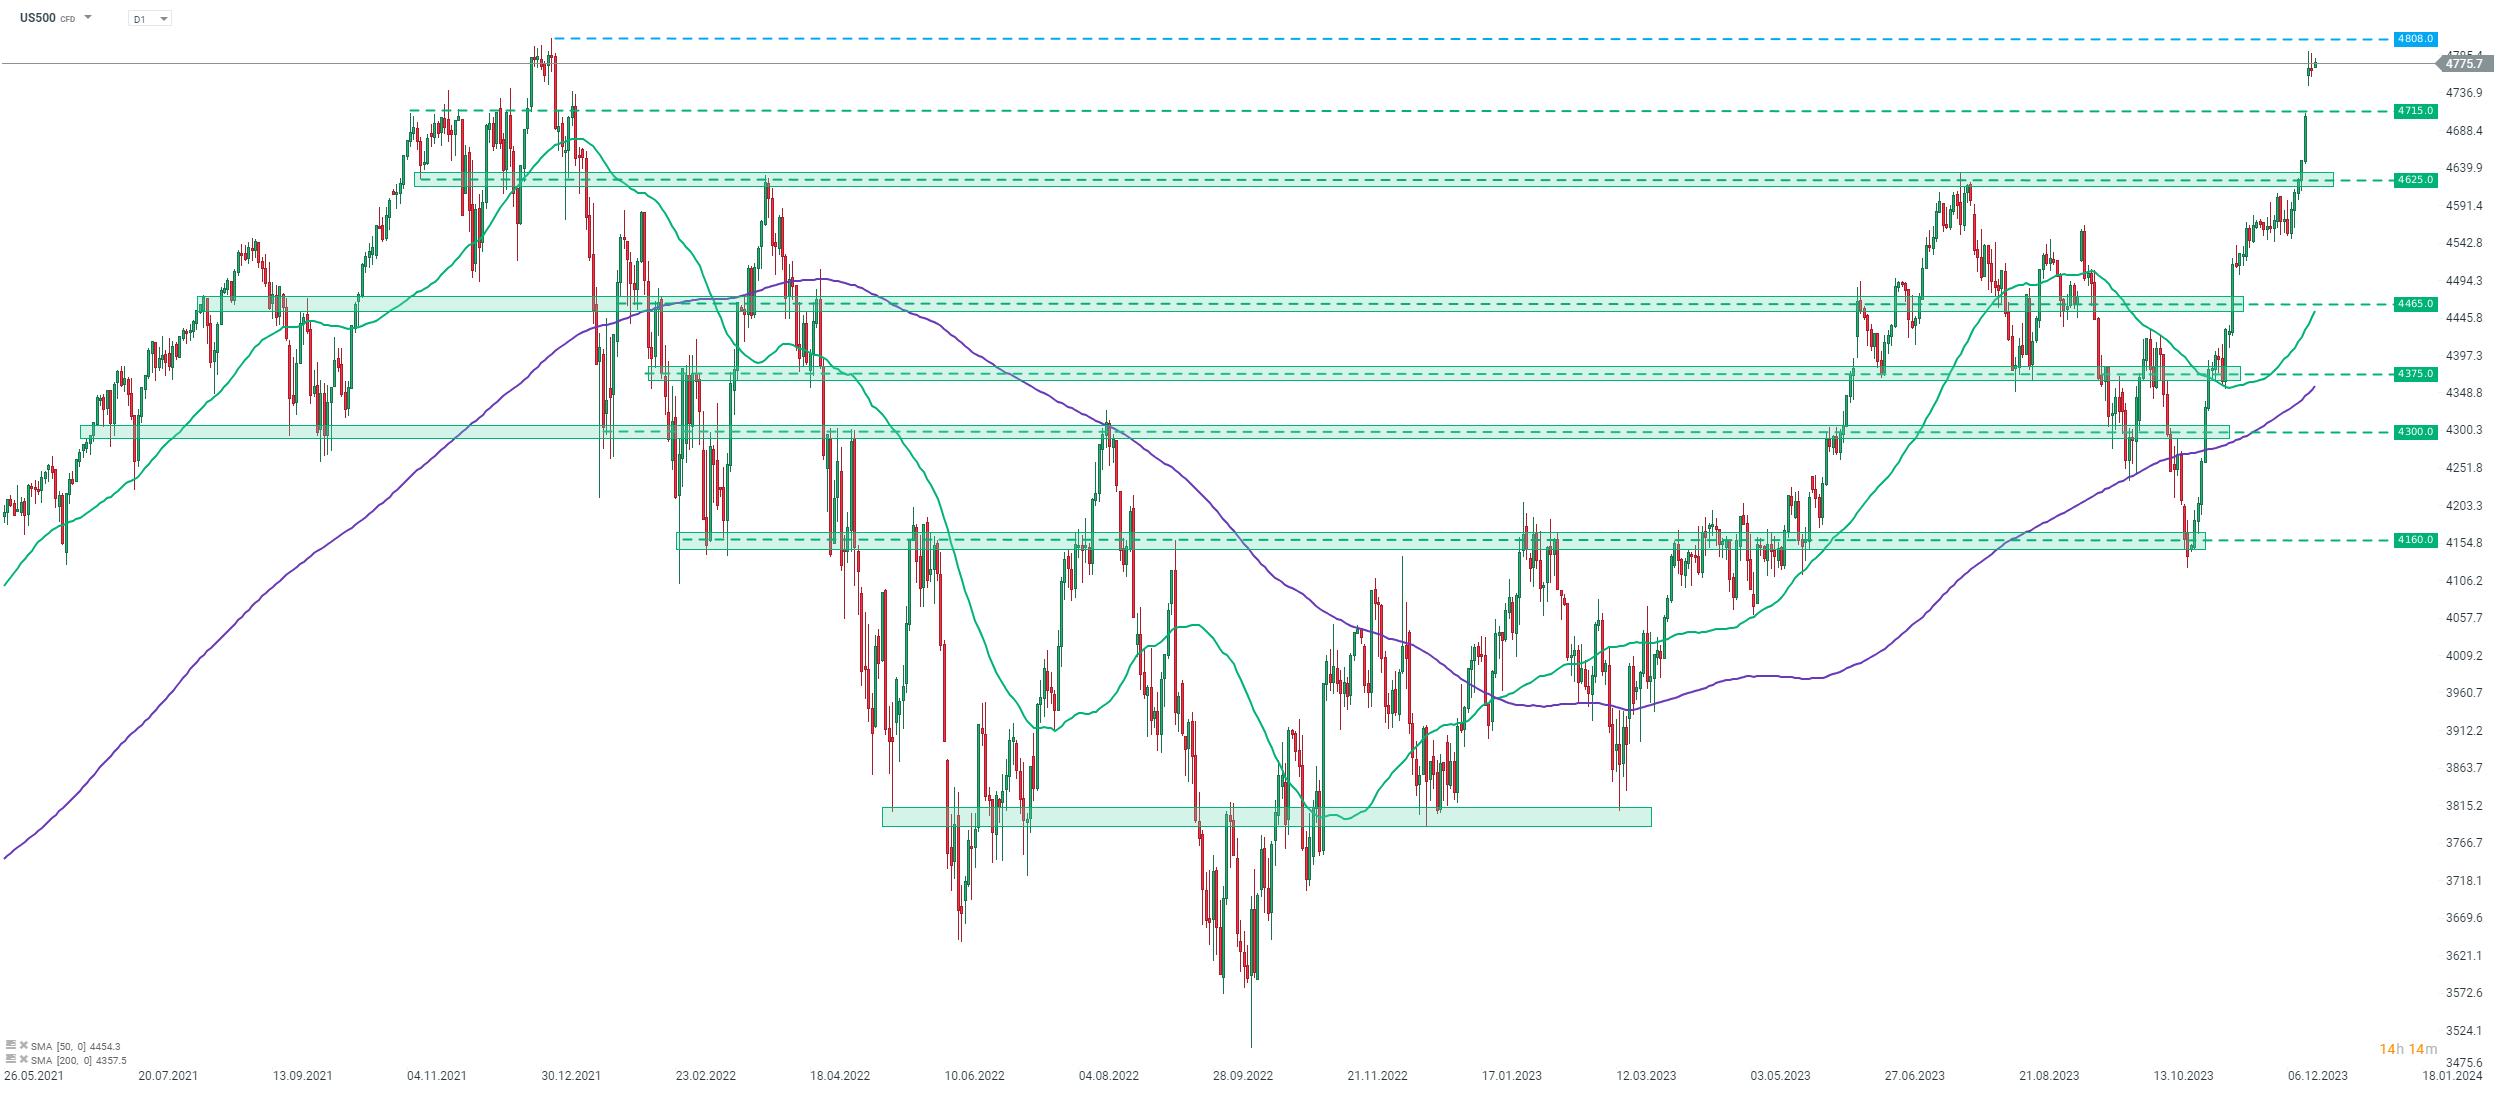
Taking a look at US500 chart at D1 interval, we can see that while the index finished Friday's trading lower, this drop can be barely noticed on the chart. US500 continues to trade slightly below 4,800 pts, where all-time highs can be found. This is also a key near-term resistance level to watch. On the other hand, should we see bears regain control over the market, the first support to watch can be found in the 4,715 pts area, where previous price reaction as well as the lower limit of the post-FOMC bullish price gap can be found.
 Source: xStation5

Daily Summary: Wall Street Regains Ground; Another Intervention in the Yen Market❓

Three Markets to Watch Next Week (July 31, 2026)

Market Wrap: European equities at 3-week highs! Apple dips in US premarket!

Economic Calendar: Key European CPI Readings and Oil Giants’ Earnings