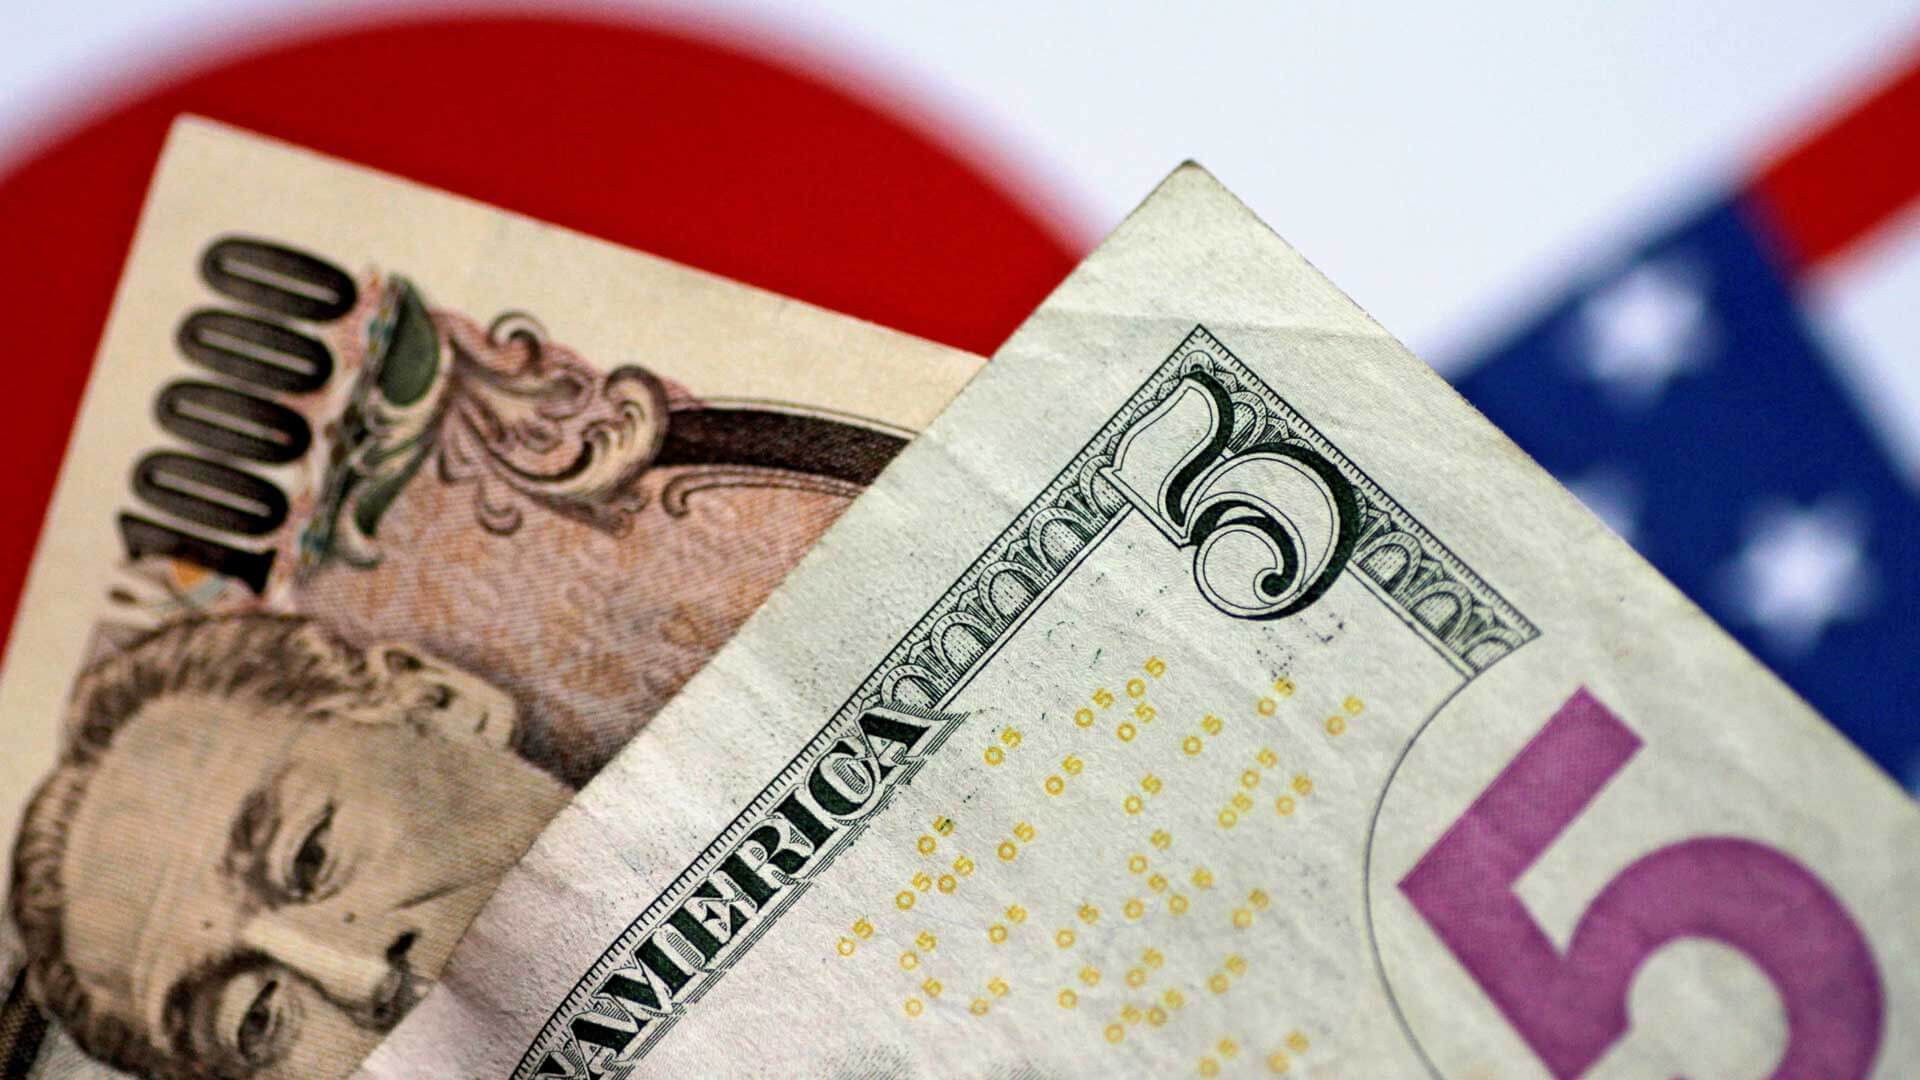
US dollar has been the best performing G10 currency this week as lingering debt ceiling negotiations led to a spike in yields and provided support for the greenback. Negotiators failed to reach a deal yesterday but talks are continuing and progress is being made. However, such comments are constantly being offered to the public and are yet to translate into any definite agreement. Nevertheless, agreement preventing default looks likely and given a strong US data recently, Fed may be set to deliver one more rate hike. Money markets currently price in 21 basis points of tightening by July meeting (July 26, 2023). A strong core PCE reading for April, scheduled for 1:30 pm BST today, may see those odds rise further and would likely support USD.
Taking a look at the USDJPY chart at D1 interval, we can see that the pair has been trading in an upward channel since early-January 2023. Bulls managed to push the pair above the 139.25 resistance zone at the beginning of this week after two failed attempts earlier this year (early-March and early-May). The next resistance zone to watch can be found in the 142.00 area, and more or less coincides with the upper limit of the bullish channel.
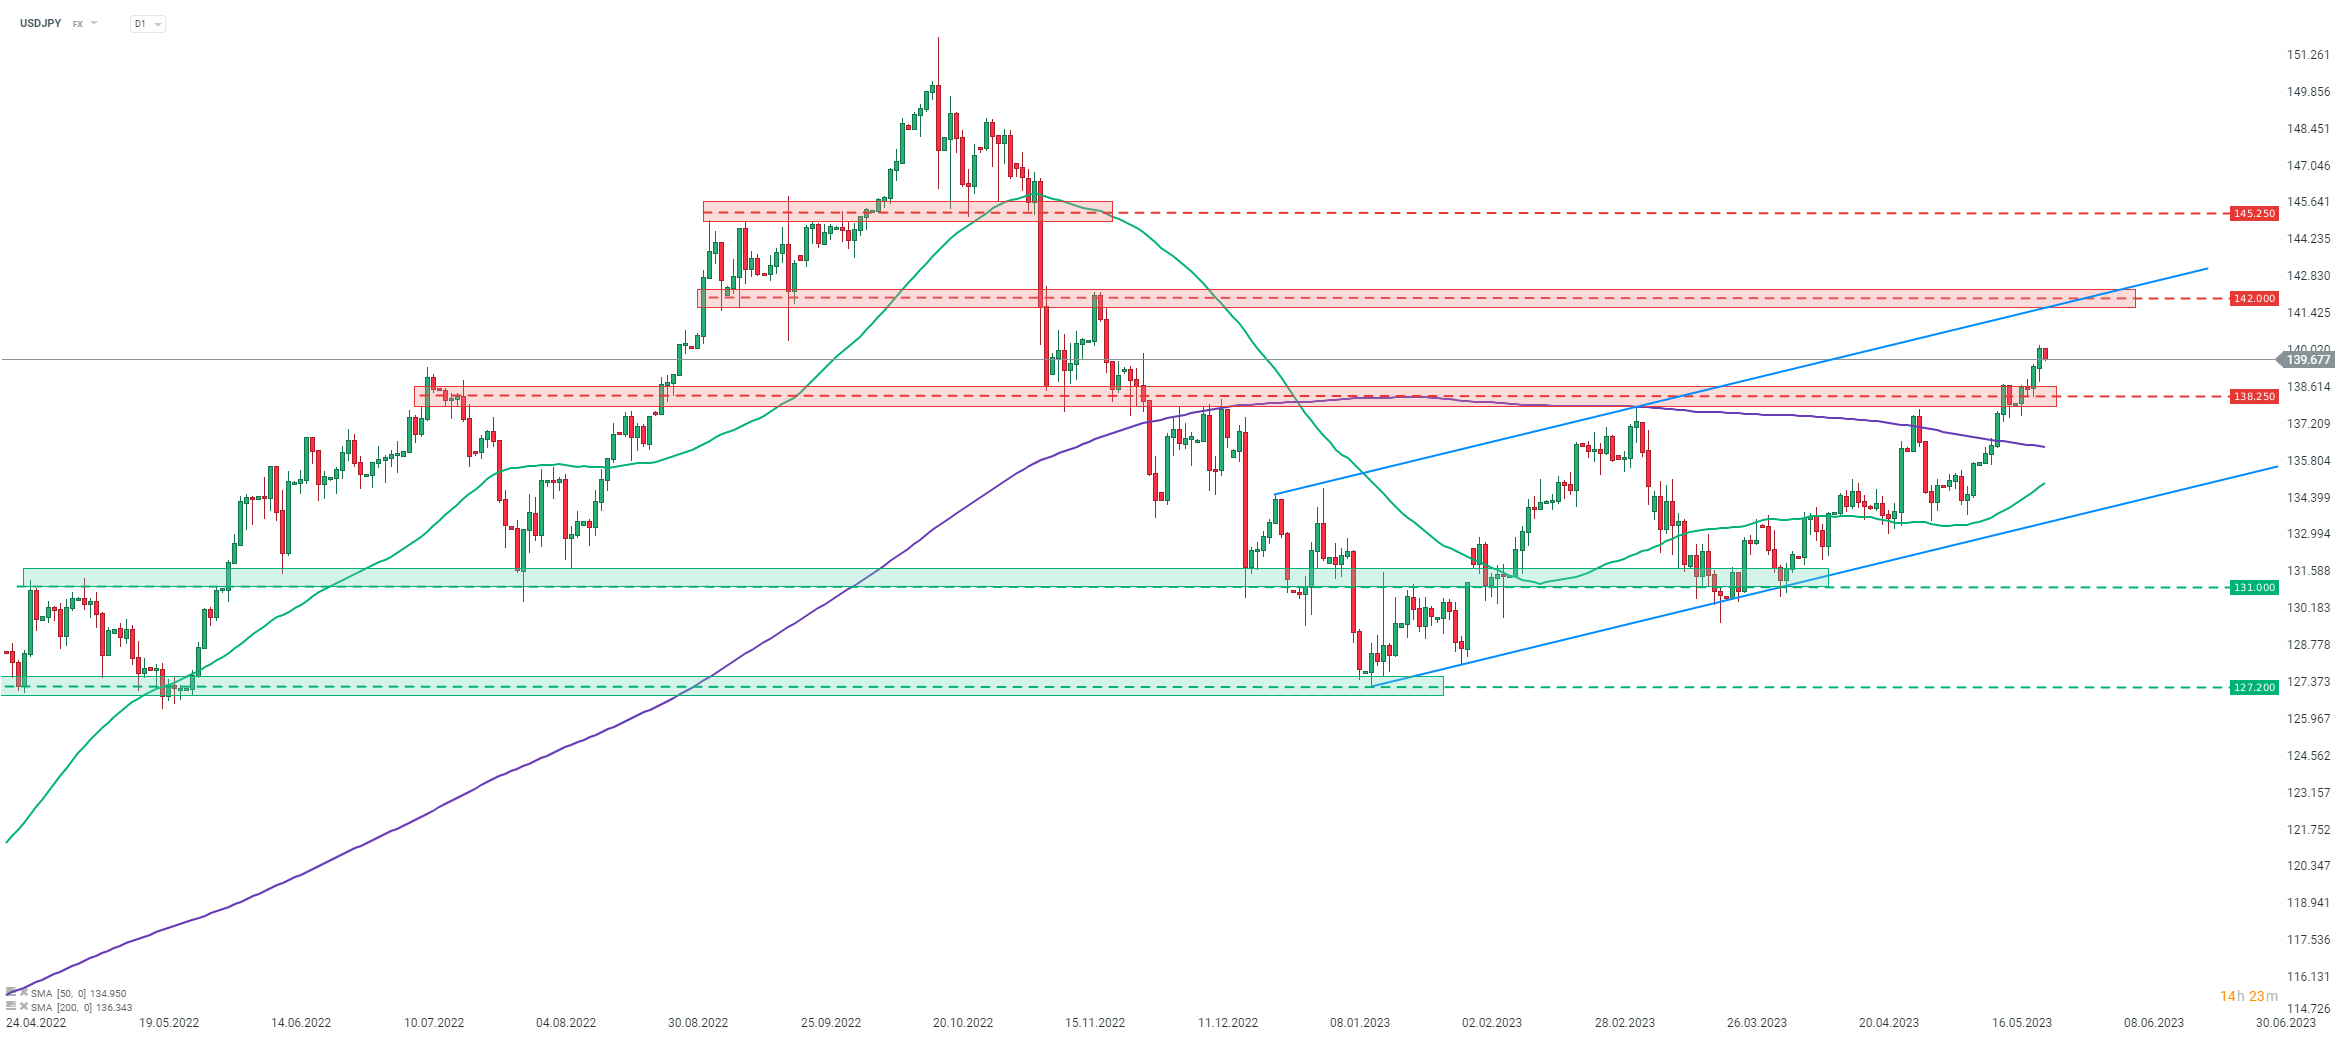 Source: xStation5

Economic Calendar: Time for Tesla and Google Earnings (22.07.2026)

Morning Wrap: AI companies and gold back in favour? (22.07.2026)

Daily Summary: Semiconductors Rise in the Shadow of Geopolitical Turmoil
Market Wrap: Airlines Under Pressure, Europe Resists Expensive Oil