Cryptocurrencies started this week on a positive node and major coins attempted to extend the recent rally. Bitcoin was able to break above the 50’000 USD for the first time since May, however buyers failed to uphold momentum and downward correction started. Recent declines seem to be justified, given that Bitcoin's price has risen more than 70% from July's lows, while the price of Ethereum has almost doubled. The only question is whether this will be the only slight correction which will lead to another upward move and an attack on the all-time highs highs, or is it the beginning of a larger downward move and a continuation of the bear market. From a fundamental side, recent data supports buyers. Around 6% of Bitcoin’s circulating supply has been accumulated by asset managers and companies, signaling ever increasing mainstream and institutional adoption of crypto assets. Recently Citigroup announced that it is preparing to begin offering Bitcoin futures while awaiting regulatory approval for a cryptocurrency trading desk in the United Kingdom which only confirms the growing interest in cryptocurrencies on the part of the largest financial institutions.
Another bullish sign is a rising amount of assets under management, which totaled to $57.3 b - a level not seen sincemid-May. Last week institutional investors recorded an inflow of $21 million, following six straight weeks of outflows.
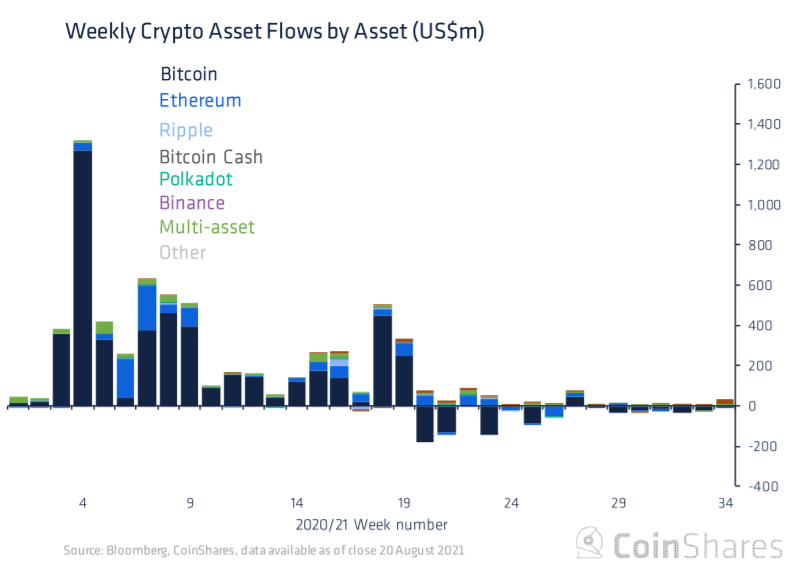
Cryptocurrency funds saw their first inflows in six weeks, which may indicate improving sentiment among investors. Source: Coinshares.
On the other hand, persistent regulatory concerns seem to hold back upward movement. Many investors fear that other countries will follow in the footsteps of the Chinese government (which caused the recent sell-off) and introduce unfavorable regulations on the cryptocurrency market.
Now, let's take a look at some of the hot names in the market
Bitcoin price failed to stay above the psychological $50,000 level and pulled back below long-term upward trendline. If current sentiment prevails, downward correction could deepen towards a strong area of resistance around $45,000 which is marked by lower limit of the 1:1 structure and previous price reactions. Only breaking above $50,000 would negate the bearish scenario and pave the way for a test of the $55,000 swing area.
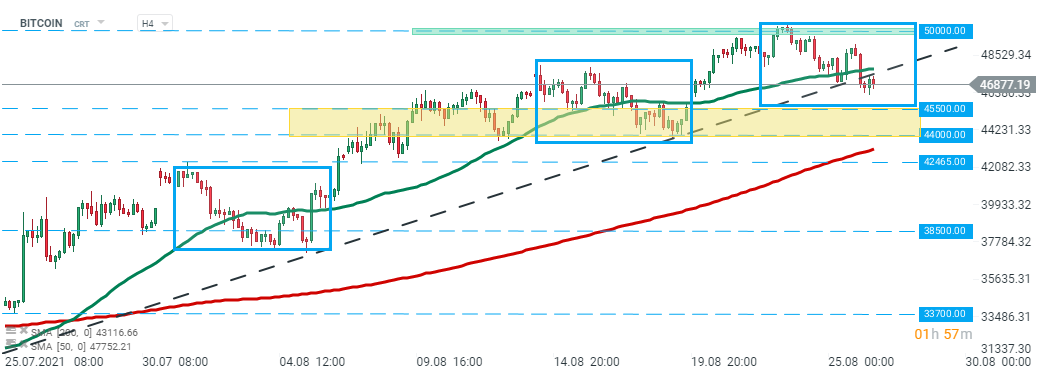 Bitcoin, H4 interval. Source: xStation5
Ethereum price rallied 36% from the beginning of August however buyers failed to break above the $3,345 resistance level which coincides with 61.8 Fibonacci retracement of the last downward wave. Currently price is approaching major support at $3000 which is marked with lower limit of the 1:1 structure, 50% Fibonacci retracement of the last downward wave, lower limit of the wedge formation and EMA 100. Should a break lower occur, the downward move towards the $2,700 area may be on the cards.
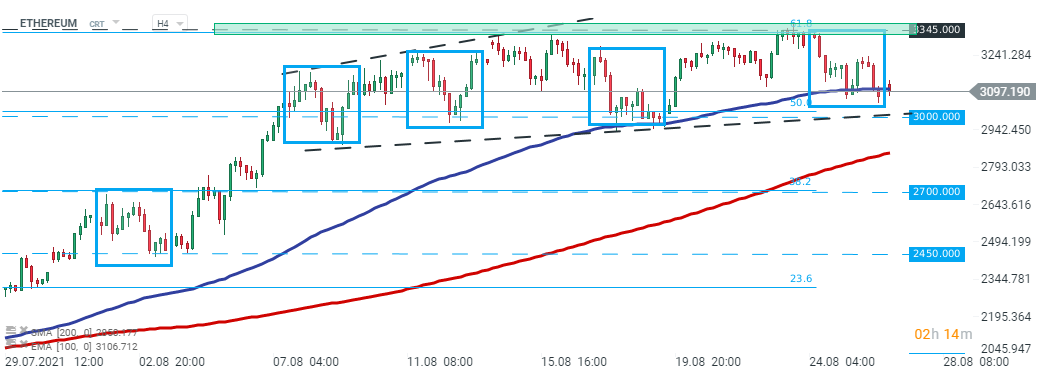 Ethereum H4 interval. Source: xStation5
Ripple - looking at the H4 interval, one can see that the potential ABC correction is building up after a strong upward move recently. Additionally price broke below the lower limit of the triangle formation. Should the current downward correction deepen, the nearest support to watch lies at 1.0300 and is marked with previous price reactions. But in case of a bigger decline, the next important support can be found at 0.9200 level, where potential market geometry lies. This level also coincides with the long-term upward trendline and 200 SMA (red line). On the other hand, if buyers manage to regain control, an upward move may accelerate towards the recent highs at 1.3300.
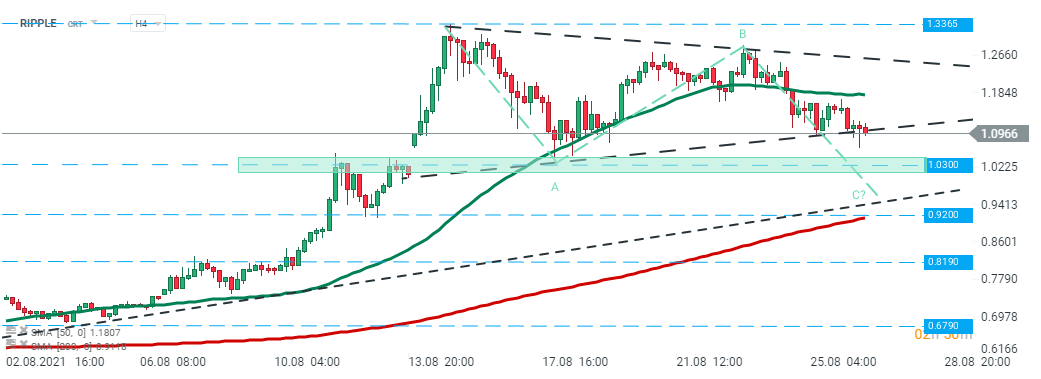 Ripple H4 interval. Source: xStation5

Market Wrap: Geopolitical déjà vu. Hormuz once again in the center of investors' attention.

Daily Wrap: Technology Leads Wall Street Higher. Markets Shrug Off US–Iran Tensions

Morning Wrap It's getting hot in the Persian Gulf again, oil is back in the spotlight.

📈 Bitcoin climbs above $62K