
Looking at the D1 interval, the price reached another target today - the level of $3,675, which results from previous price reactions. If the upward movement continues, an attack on resistance in the $4,000 region, i.e., historical highs, cannot be ruled out. On the other hand, in the event of a pullback, the nearest support will be the $3,400 level, which previously acted as resistance. For now, however, there are no supply signals on the chart.
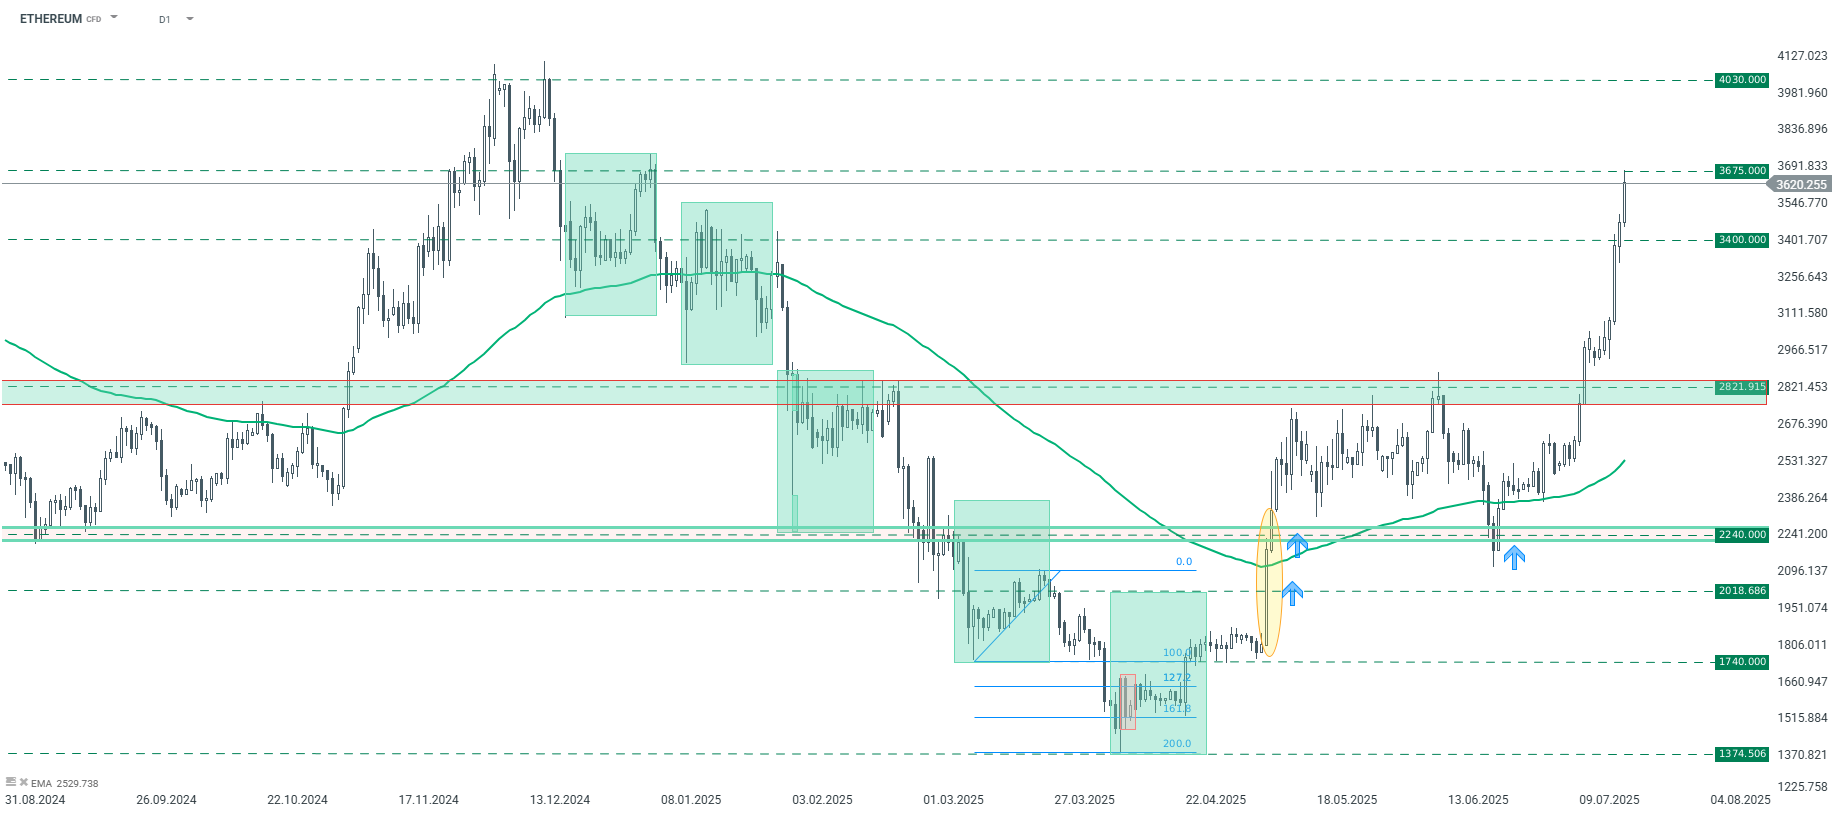
Ethereum D1 interval. Source: xStation5
As for the lower time interval - H1, we are dealing with a strong upward trend. The price has made several corrections of the same range (marked with green rectangles), which, according to the Overbalance methodology, indicates a continuation of the trend. Therefore, it seems that as long as the 1:1 geometry is not negated, a further increase is possible. Even if the price falls below the 1:1 pattern, the EMA100 average, marked with a blue line in the chart below, will be a noteworthy support level.
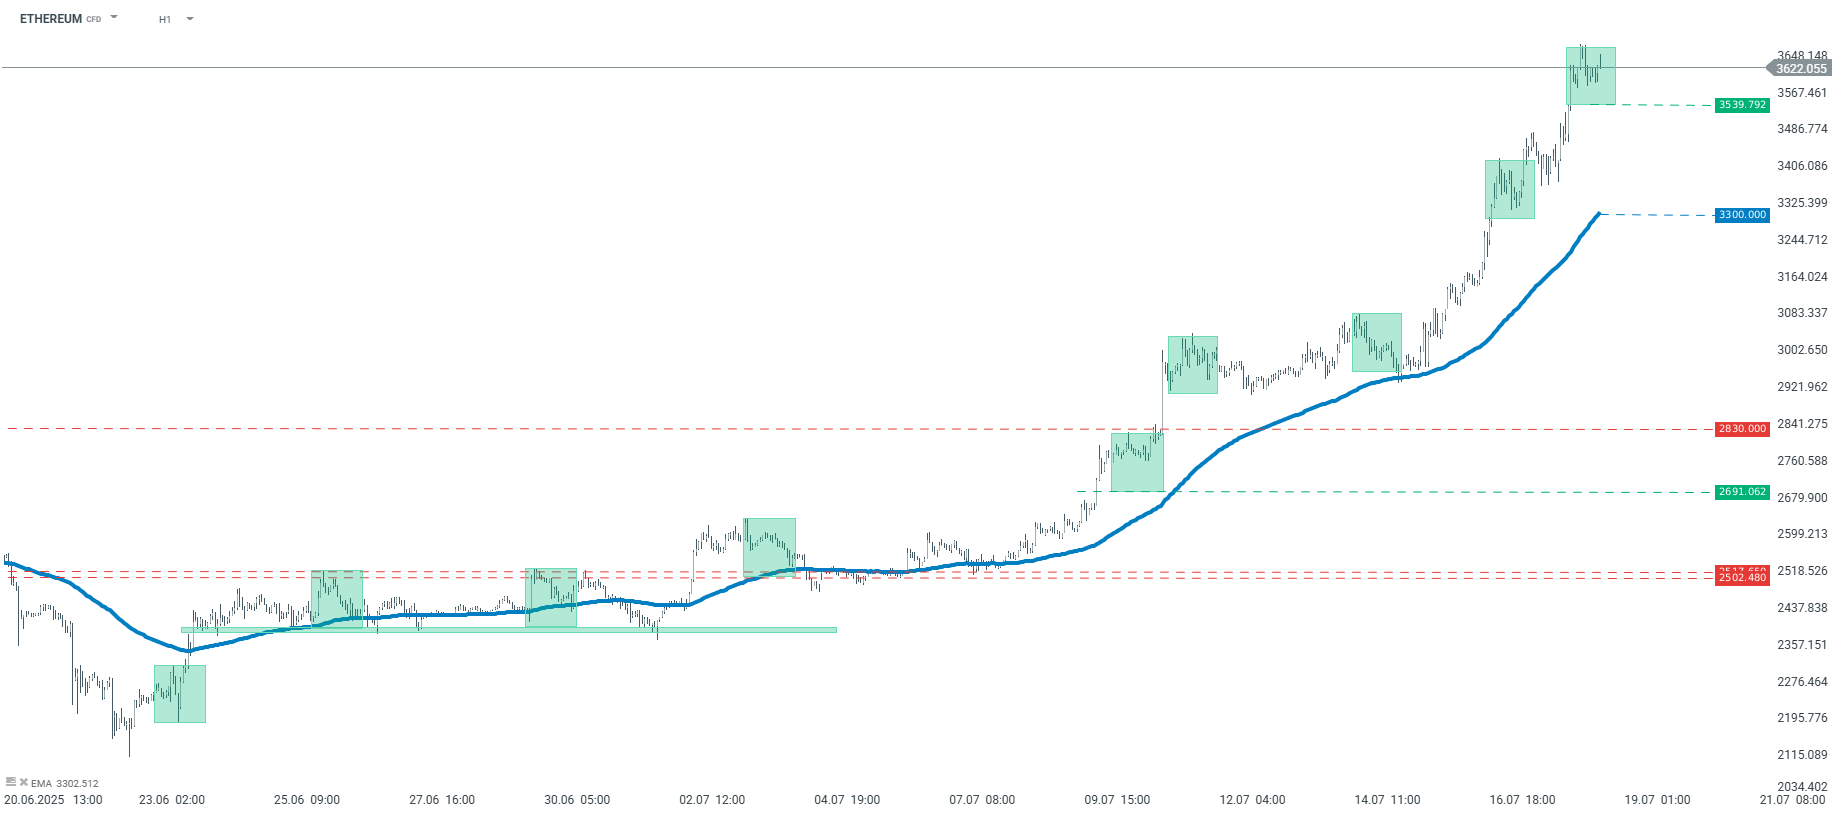
Ethereum H1 interval. Source: xStation5

🔼 Bitcoin jumps above $65k

US Open: S&P 500 Gains on Softer PPI Inflation 🔼 Memory Stocks Slip, PayPal Surges 15%

BREAKING: US PPI Confirms Cooling Price Pressure Trend From CPI

Daily Summary: Lower inflation weakens the dollar and awakens gold and S&P 500 to gains