
This year has been marked by corrections in major stock indices, leading to new downward pressures on the EUR/USD pair (-0.83% YTD).
But, is this trend likely to persist?
Well, looking at the divergence between the U.S. dollar index and the TNOTE chart, we can see that this scenario typically supports USD strength.
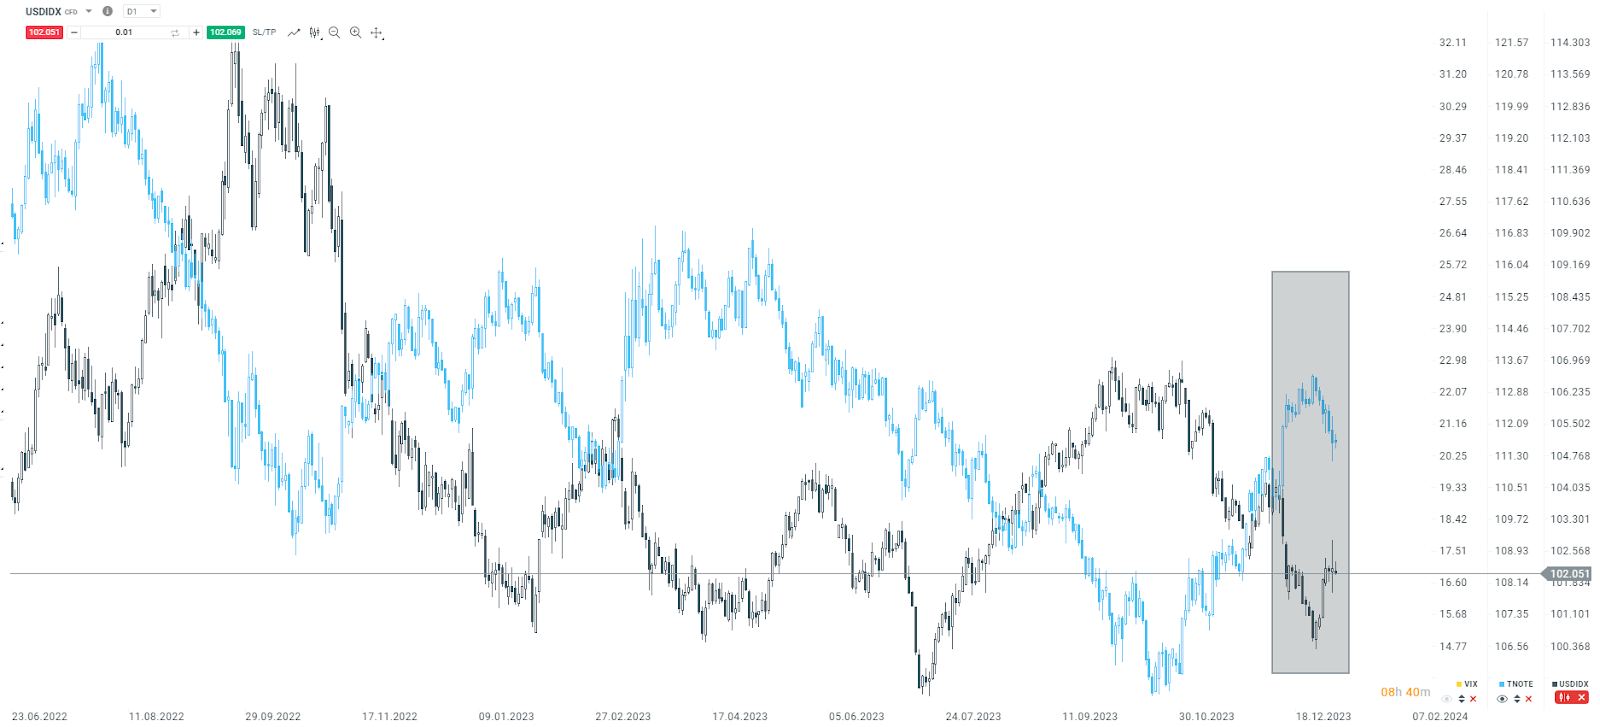
USD Index and TNOTES., Daily time frame chart. Source: xStation 5
On the other hand, the EUR/USD pair doesn't seem to show any strong technical signals that the downward trend could resume. Nevertheless, on the 4-hour chart, we observe that the resistance zone marked by the grey rectangle, along with the EMA, has played a significant role.
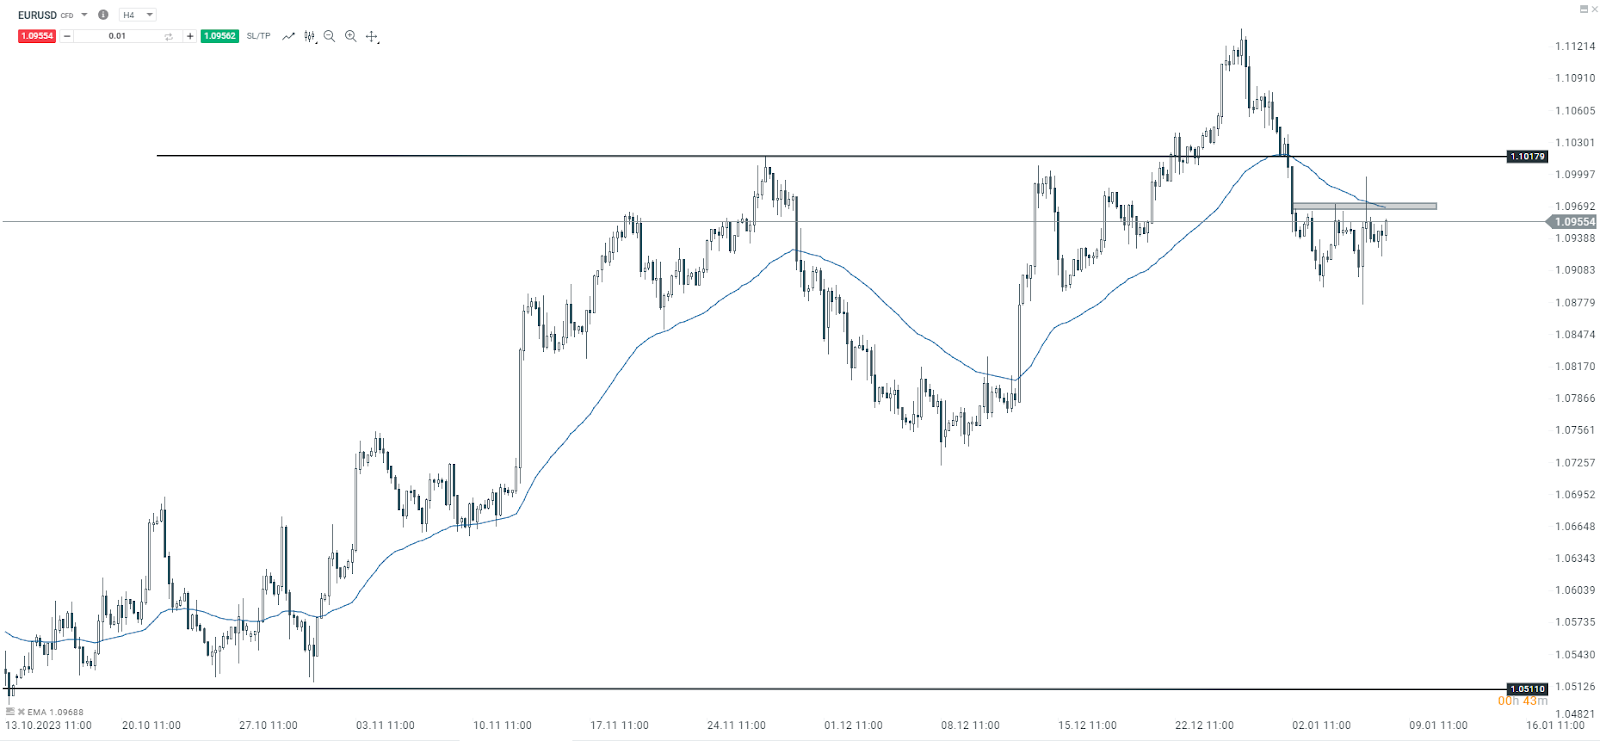
EUR/USD. 4 hours time frame chart. Source: xStation 5
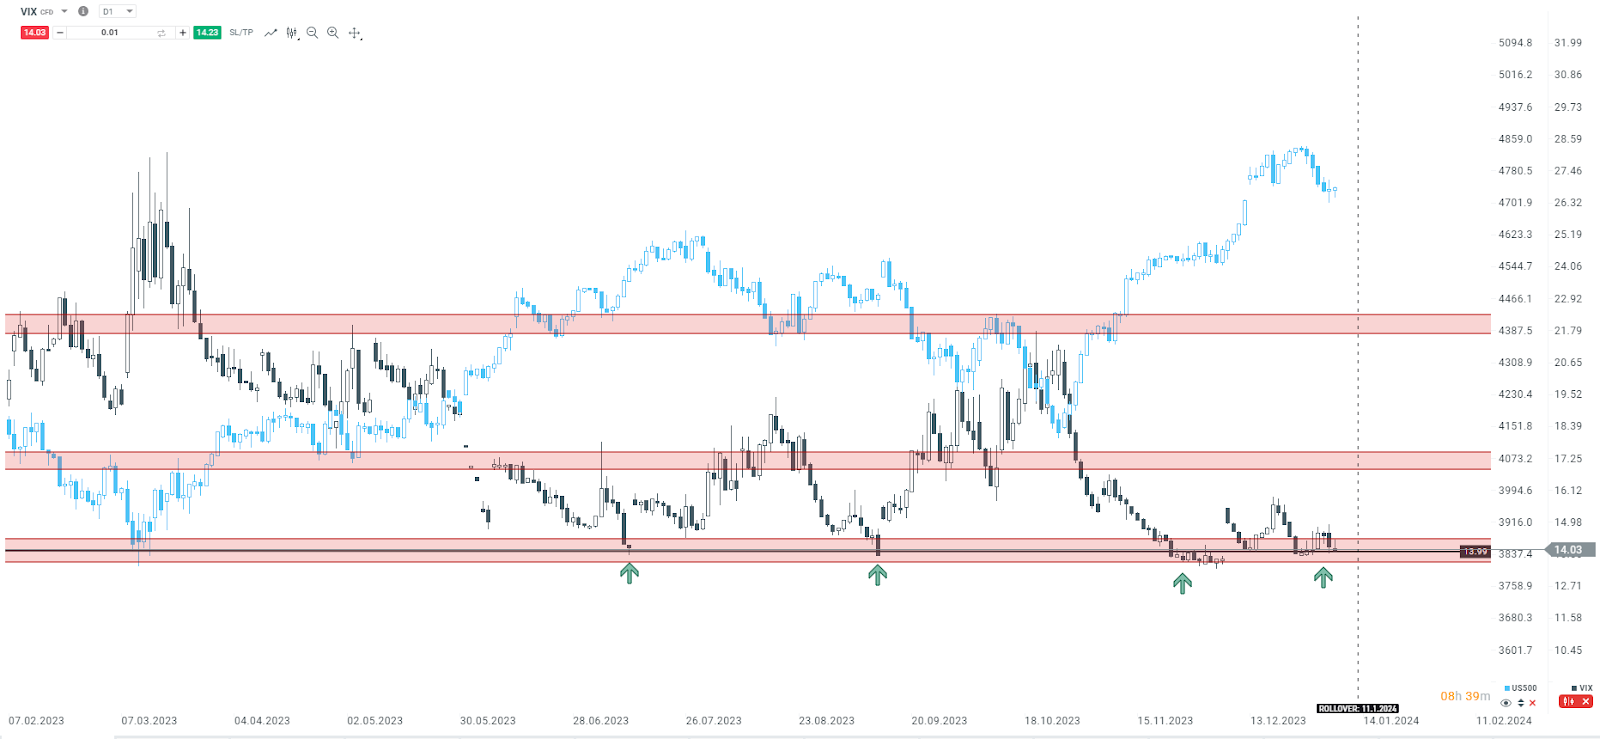
VIX and USD Index. Daily Time Frame Chart. Source: xStation 5
Henrique Tomé,
Analyst at XTB Portugal

BREAKING: US PPI Confirms Cooling Price Pressure Trend From CPI

Figure of the Day: What is next for July’s strongest currency? (15.07.2026)

Economic Calendar: Wednesday brings big Q2 earnings and PPI inflation (15.07.2026)

Morning Wrap: What’s next with the Strait of Hormuz, inflation and US interest rates? (15.07.2026)