



This week, the EUR/USD pair will be in the spotlight as important data about the American economy is released. Investors will be closely monitoring the U.S. inflation results, measured by the CPI and PPI, as well as retail sales. These events will increase the market volatility.
On the one-hour chart, we can see that buyers have managed to break through important technical structures that have supported the recent recovery of the euro against the dollar. Currently, the price is trading near the lower boundary of the consolidation zone, and a break above this zone could lead to further momentum.
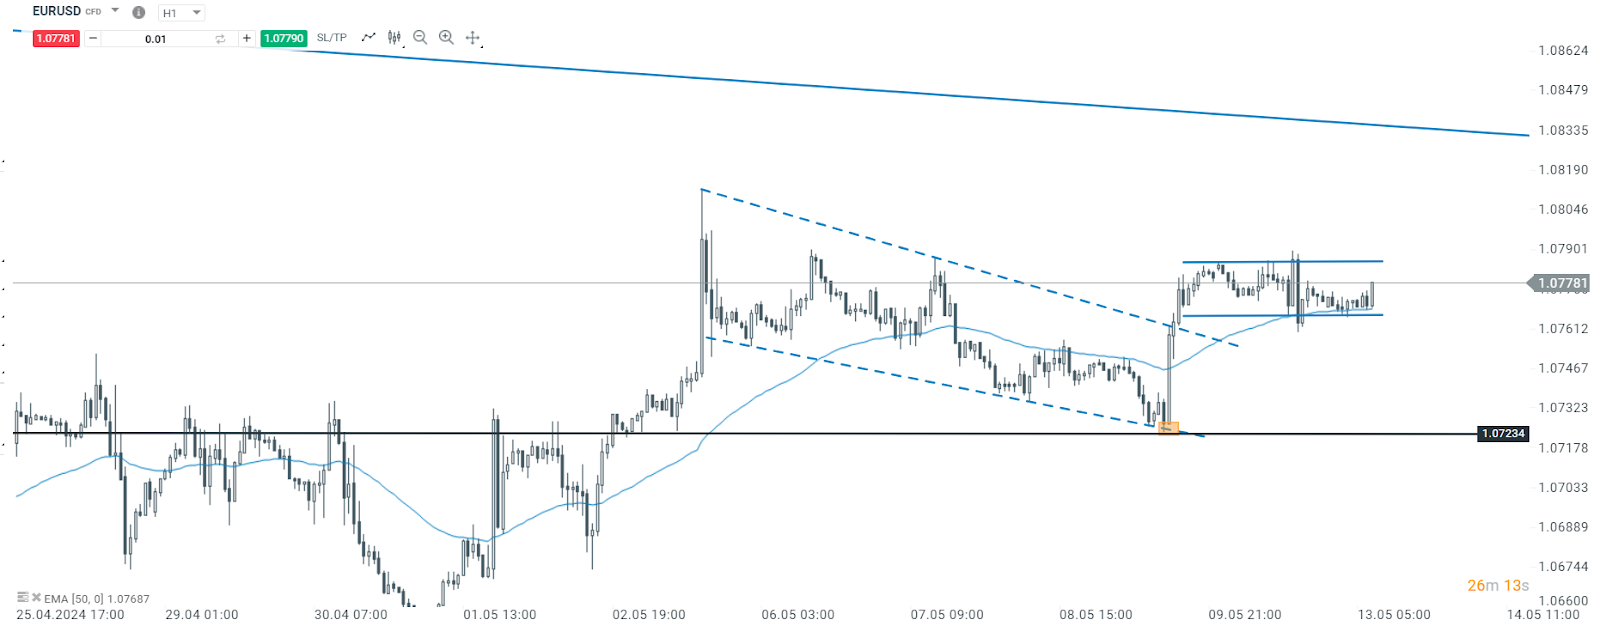
EUR/USD 1 hour time frame chart. Source: xStation 5
Additionally, if we observe the behavior of the U.S. dollar with bonds, we note a resurgence of divergence between the two markets, which could be a sign that the USD has room to decline further.
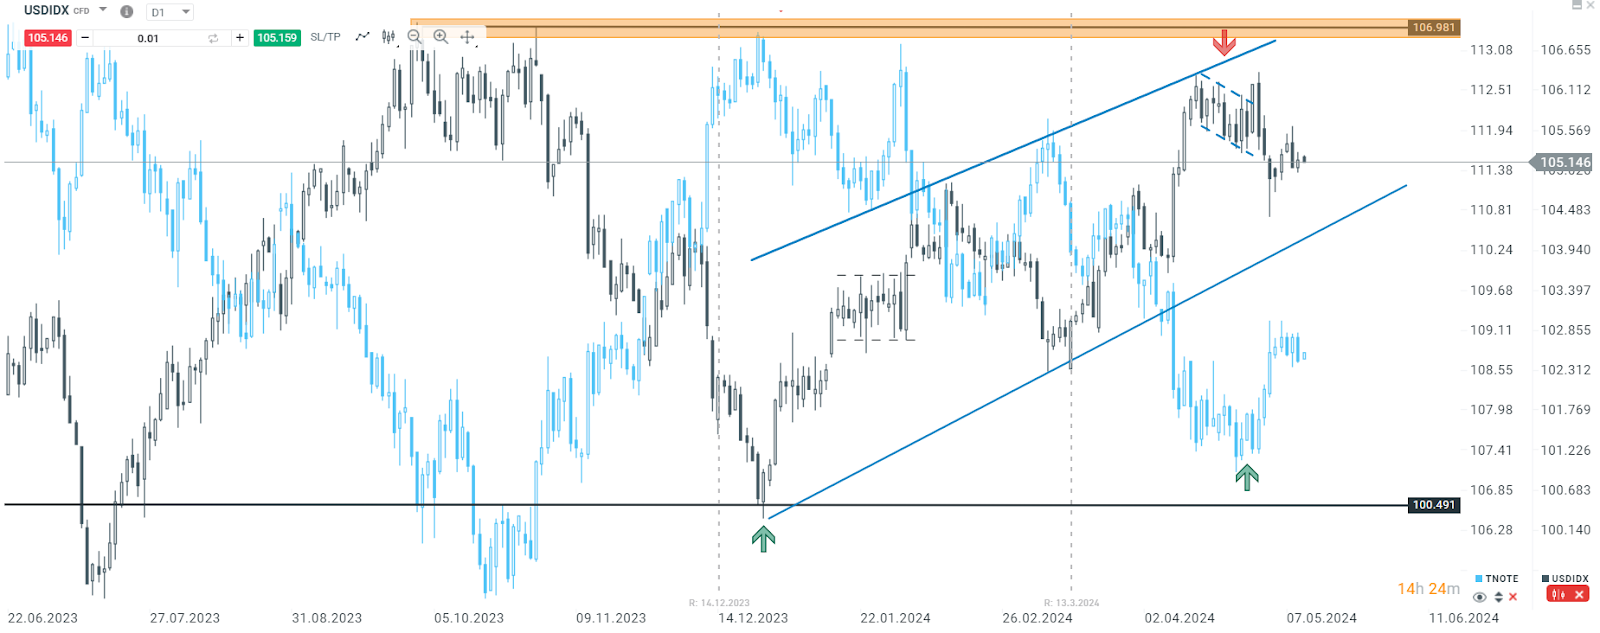
Dollar Index, Daily time frame chart. Source: xStation 5
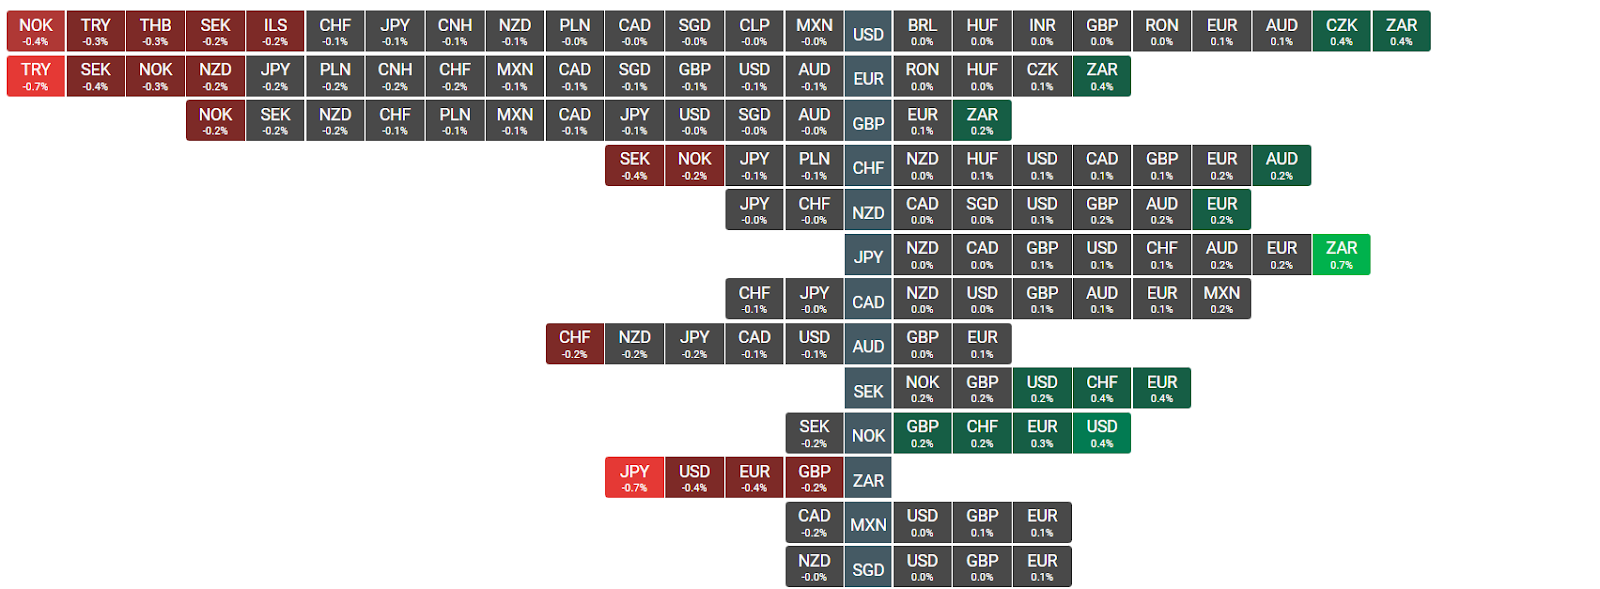
Forex Heatmap. Source: xStation 5
Henrique Tomé,Analyst Portugal


Market Wrap: Clear rebound in Europe against falling oil price. Assets related to Brazil in retreat


Chart of the day: European gas ever closer to 100 EURMWh


Economic Calendar - German Ifo index, Middle East escalation, and Wall Street giants' earnings



Elections in Brazil: Lula returns to power, markets react with panic. Brazilian ETF loses nearly 15% in Tokyo. What about USDBRL, soybeans, sugar, BRAComp, and ETFs?