
Just before the start of the US session, the gold price fell sharply and broke below the support around the $ 1740.8. As can be seen in the chart below, a bottom shadow is currently forming, which poses a risk of a rebound. However, if the price remains below the aforementioned level of $ 1740.8 (which should now act as resistance), a deepening of the sell-off is possible. The $ 1729 zone should be considered as major support, and is marked with earlier price reactions and 78.6% Fibonacci retracement.
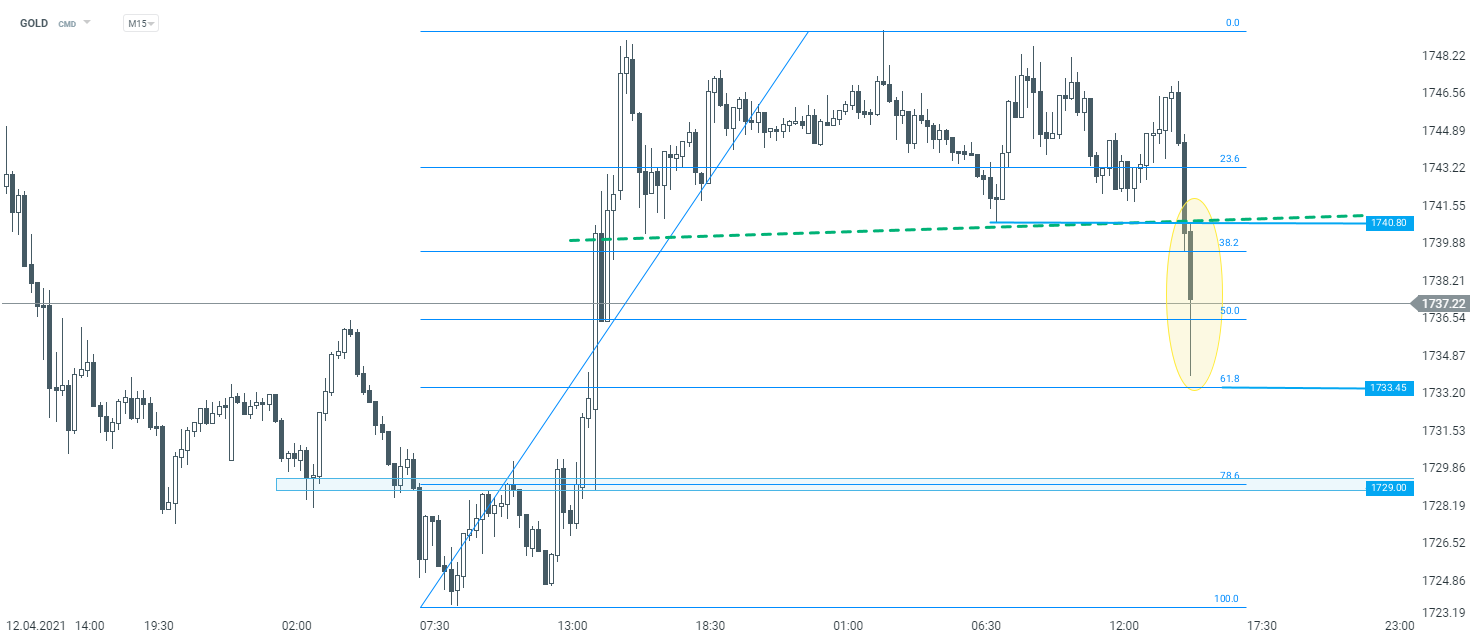 GOLD interval M15. Source: xStation5

Daily Summary: Wall Street Regains Ground; Another Intervention in the Yen Market❓

Three Markets to Watch Next Week (July 31, 2026)

Market Wrap: European equities at 3-week highs! Apple dips in US premarket!

Economic Calendar: Key European CPI Readings and Oil Giants’ Earnings