The decline in gold prices continued today, with the scale of the correction now surpassing the pullbacks seen in April and May this year. The current correction level is comparable to the 2022 decline, though that downward move was stretched over many months. The current sell-off, by contrast, has lasted exactly seven days.
Losses since the correction began have now exceeded 11%, while the gain achieved in October has been severely reduced from 13% to just 1.5%. This means that October could become the first losing month since July if the correction extends to the $3,857 per ounce level. It is also worth noting that the sell-off in July was minimal, amounting to less than half a percent. A more significant correction took place between November and December 2024, when gold cumulatively retraced by over 4%.
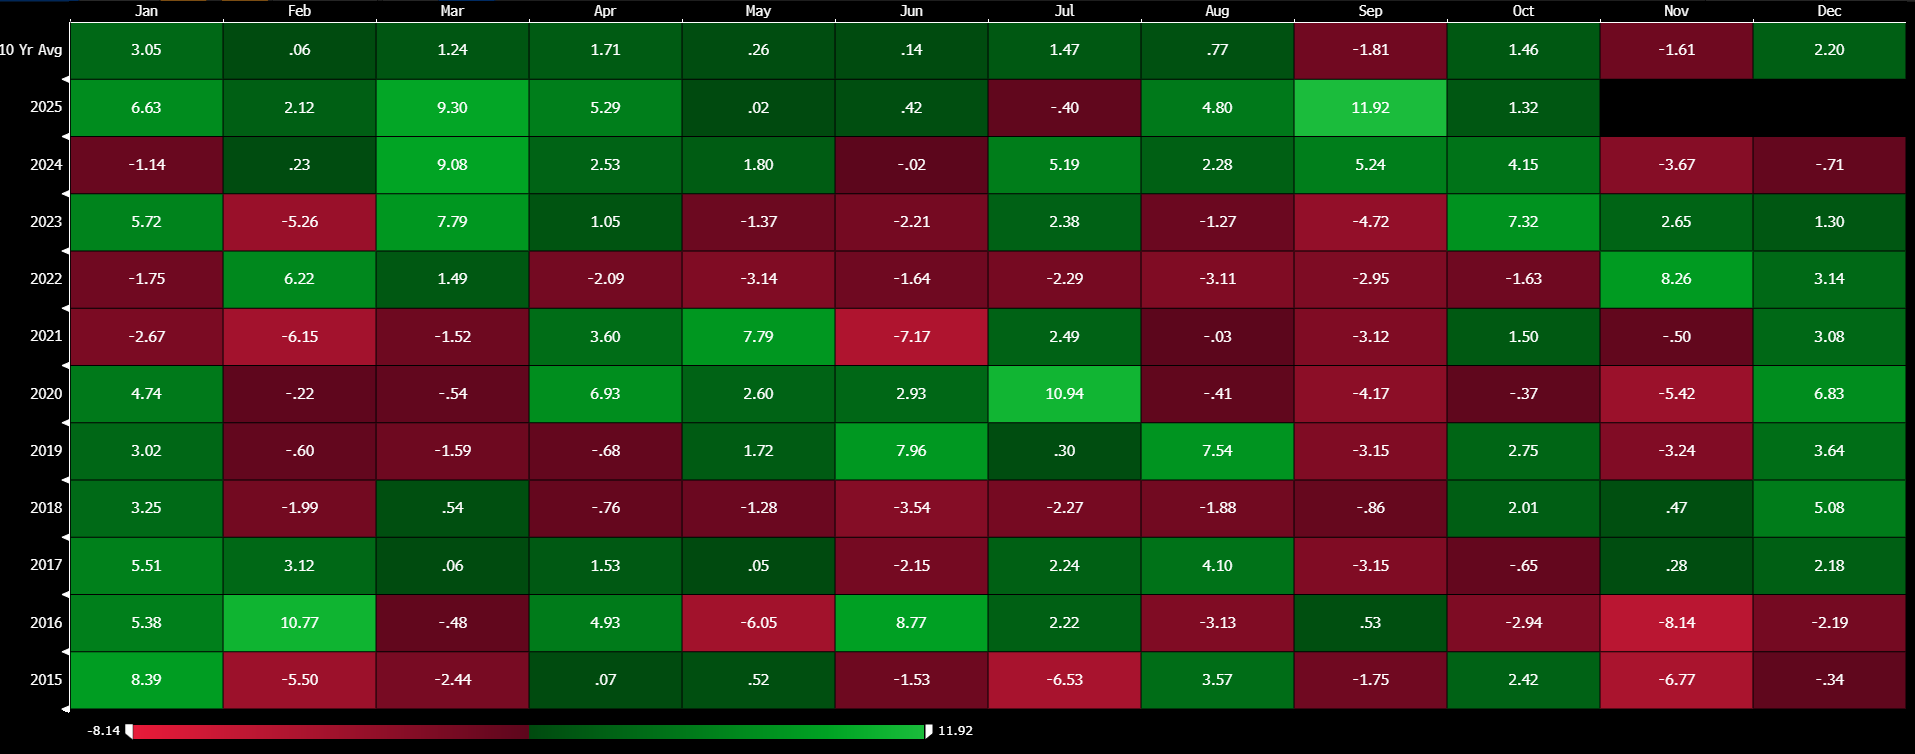 Gold has sharply curtailed its gains this month. Previously, October was potentially the strongest month in over 10 years. Source: Bloomberg Finance LP
The gold market sell-off is being motivated by improving market sentiment and profit-taking. COMEX recently raised the margin required to hold a position by approximately 5% for gold and 8% for silver. This move was mirrored by futures exchanges in Japan and India. It is evident that investors holding positions in ETFs have also decided to realize profits. Looking across all funds, ETFs are selling gold at the fastest pace since April and May. Simultaneously, the world’s largest gold ETF, the US-based SDPR Gold Shares (GLD.US), experienced its largest daily outflow since April, marking one of the largest single-day outflows in years. GLD is now experiencing its fourth consecutive day of outflows.
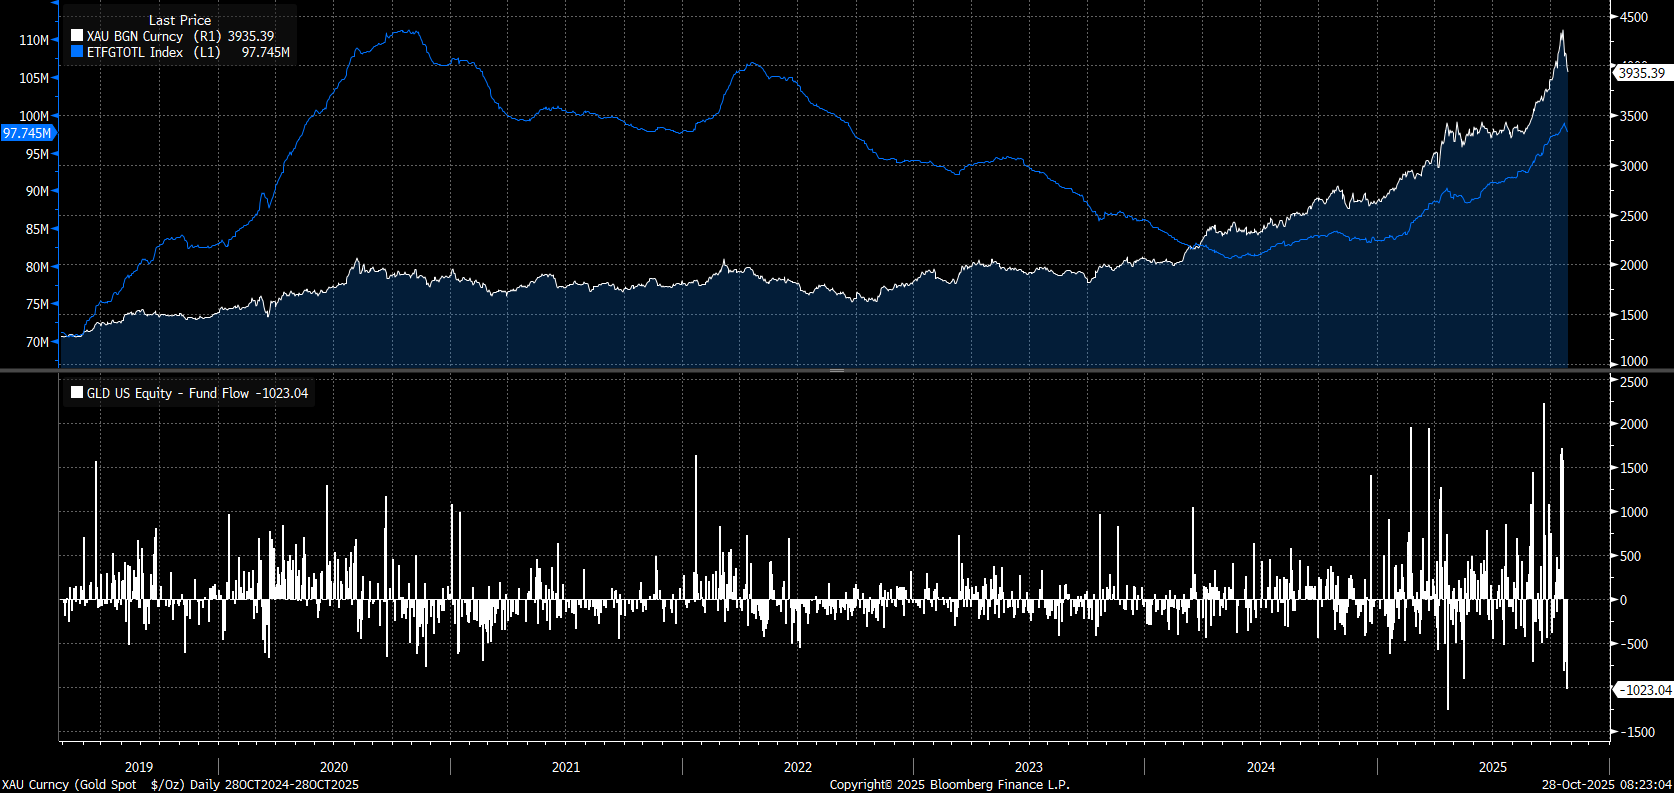 ETFs are selling gold in anticipation of a US-China trade deal. The Fed's decision may also be significant. If the Fed is cautious in communicating further rate cuts, it could push gold to even lower levels. Source: Bloomberg Finance LP
Gold temporarily retreated below $3,900 per ounce today, breaching the 38.2% Fibonacci retracement and approaching support at the 50.0% retracement of the last major uptrend. The scale of the correction exceeds what we observed in April and May.
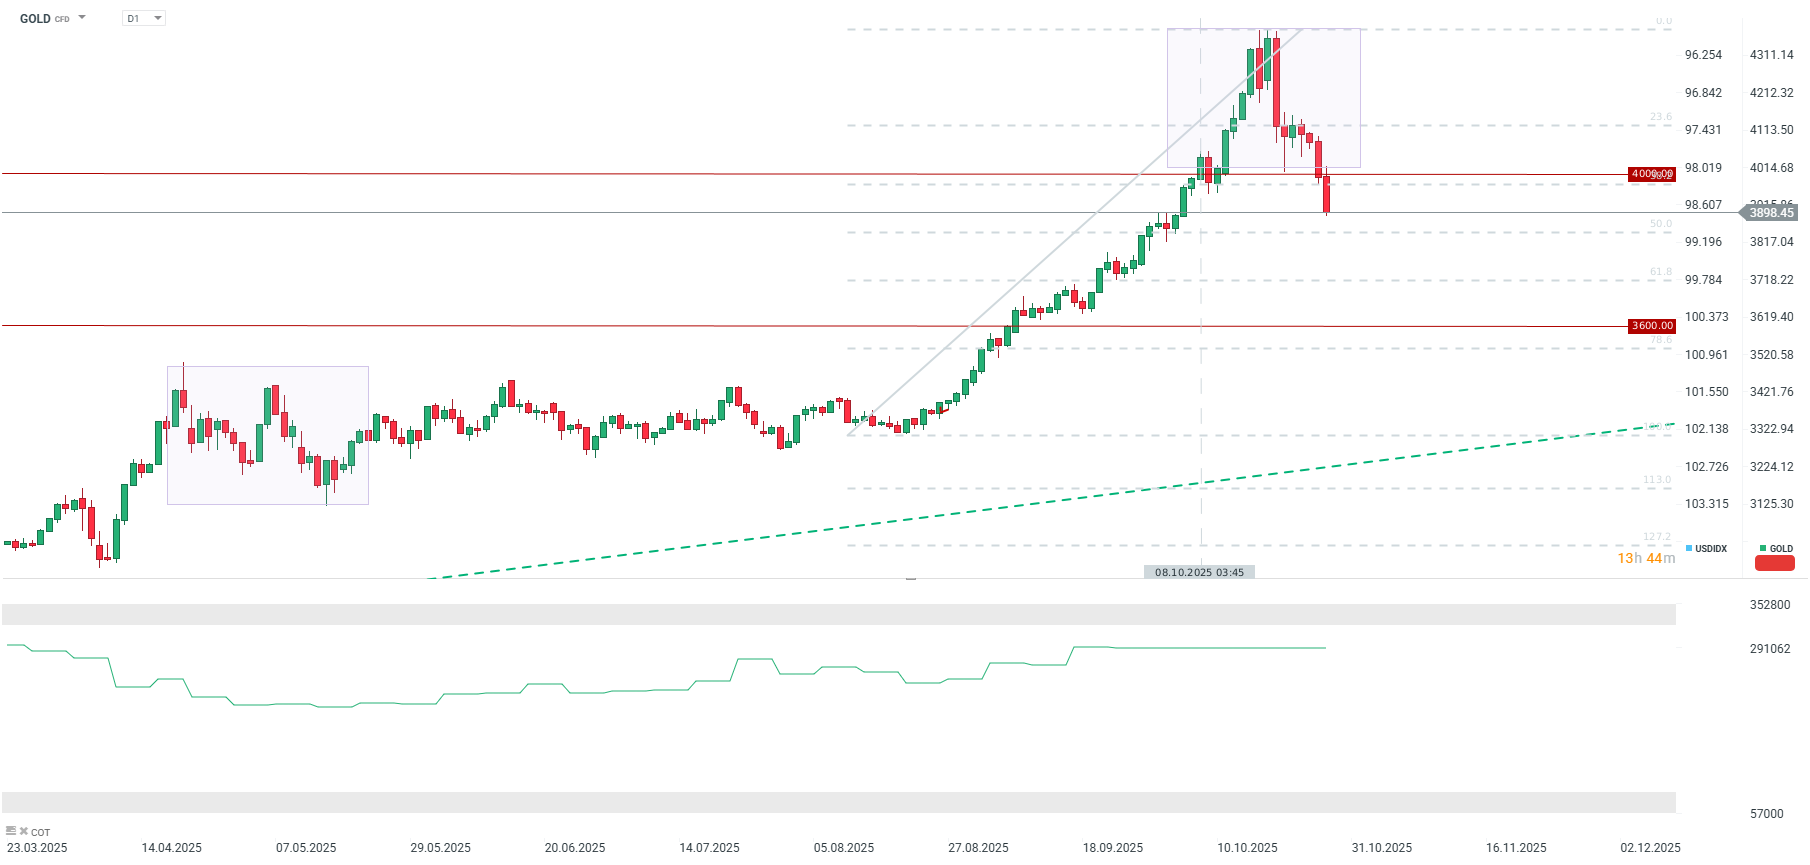 Gold today temporarily falls below $3,900 per ounce, breaking the 38.2% retracement and approaching support at the 50.0% retracement of the latest upward wave. The scale of the correction exceeds what was observed in April and May. Source: xStation5
Looking at the price decline on the monthly chart, we could potentially see a massive 'wick' forming on the October monthly candle. The previous large candle wick occurred in April, which ultimately led to several months of consolidation.
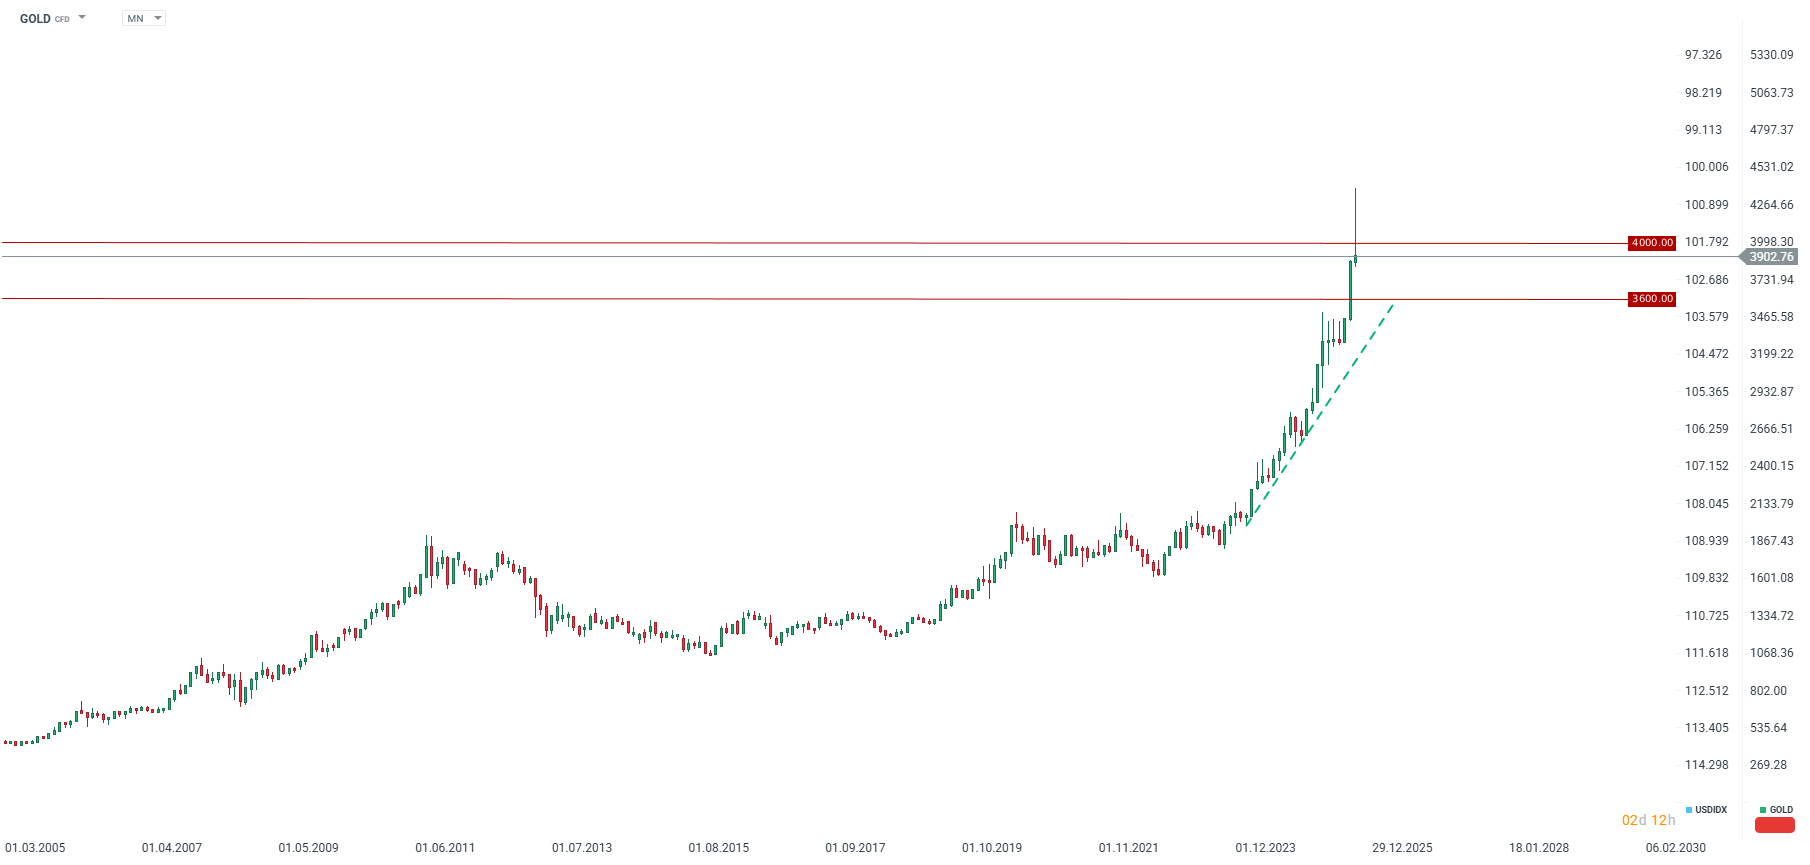
Source: xStation5

🛢️Brent Crude Oil Tests $95 per Barrel

Morning Wrap: AI companies and gold back in favour? (22.07.2026)

Daily Summary: Semiconductors Rise in the Shadow of Geopolitical Turmoil

Tech sector catches its breath 🚀