



- Falling bond yields are supporting the rebound after yesterday’s negative session, when gold prices declined by nearly 2% amid rising long-term bond yields in the U.S., Germany and Japan.
- The market is awaiting the minutes from the Fed’s July meeting, which may provide further clues on the future path of interest rates.
- According to CME FedWatch, investors are pricing in a 65% probability that rates will remain unchanged in September. Expectations for a rate hike have weakened following a series of softer U.S. economic data.
- Unchanged U.S. interest rates would generally be supportive for gold, as they would reduce the opportunity cost of holding a non-yielding asset.
- Geopolitical tensions remain a very important factor: oil prices have risen to their highest level in three weeks amid uncertainty over shipping through the Strait of Hormuz.
GOLD (D1 chart)
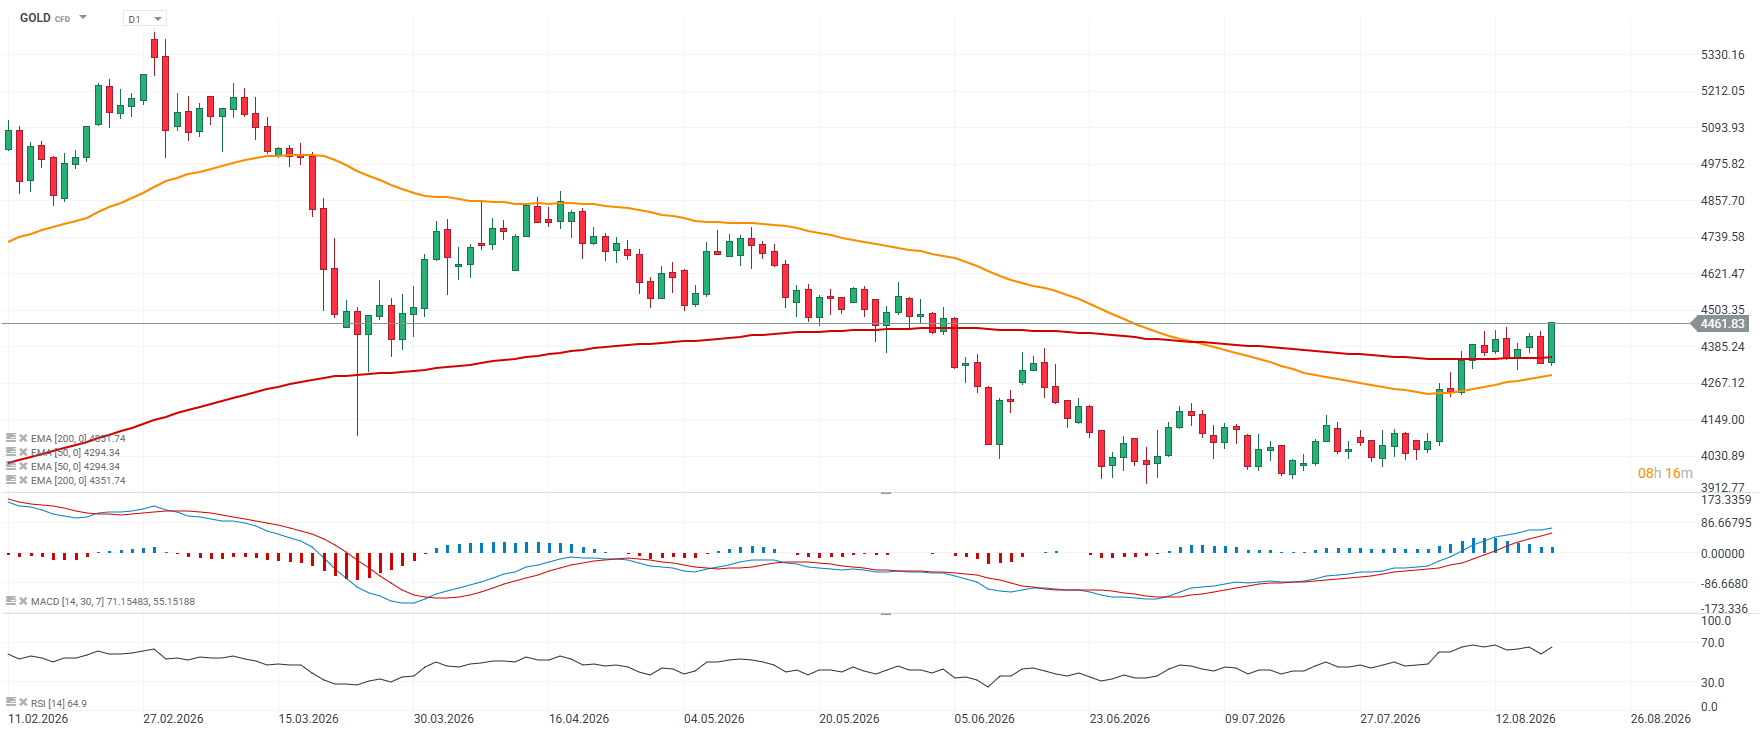
The technical picture for gold is looking increasingly constructive. The price has broken decisively above the key EMA200 support level (red line) and is now testing the 4,460 area, while the RSI remains just below 65, leaving room for a potential continuation of the upward move.
Source: xStation5
Gold market positioning: speculators maintain long exposure
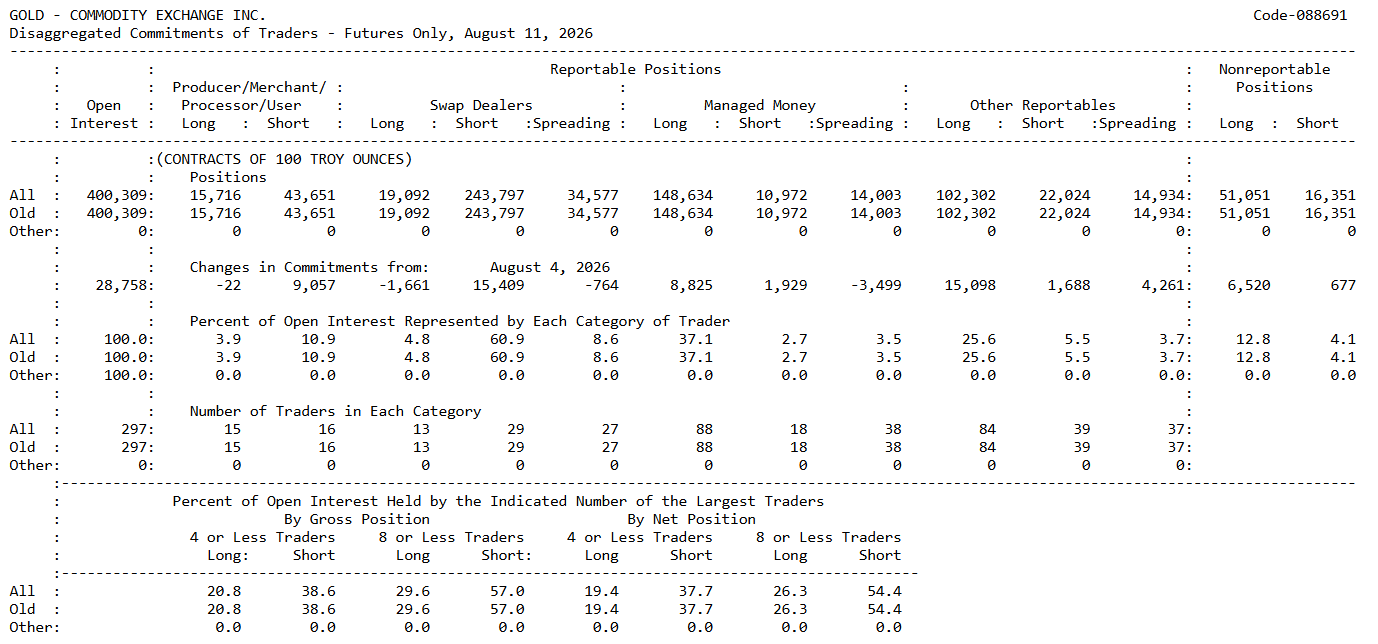
Commitment of Traders data from August 11 clearly shows that funds in the Managed Money category remain heavily positioned on the long side of the gold market. Their long positions stand at 148.6k contracts, while shorts amount to only 11.0k, resulting in a net long position of around 137.7k contracts. This is clearly one-sided positioning. Funds continue to assume that the prevailing upward trend has not yet been exhausted.
It is worth looking not only at the absolute level of positioning, but also at the weekly change. Managed Money increased long positions by 8.8k contracts, while shorts rose by only 1.9k. As a result, the net position increased by nearly 6.9k contracts. Speculative capital is therefore not reducing exposure after the recent gains, but continues to add positions on the same side of the market.
The scale of this imbalance is also clearly visible in the structure of open interest. Managed Money longs account for 37.1% of total open interest, while shorts represent only 2.7%. This points to a very strong conviction among funds regarding the direction of the market. At the same time, the more one-sided positioning becomes, the more relevant the risk of a sharp position unwind if momentum deteriorates.
Commercials are using high prices more actively for hedging
On the other side of the market are commercials, particularly the Producer/Merchant/Processor/User category. Producers and entities linked to the physical gold market hold 15.7k long contracts and 43.7k shorts, resulting in a net short position of around 27.9k contracts. The fact that shorts dominate is not unusual in itself. For this group, selling futures is a natural way of hedging future selling prices.
Much more important is the change in positioning over the past week. Long positions declined by just 22 contracts, while shorts increased by as much as 9.1k. This points to a clear increase in hedging activity at current price levels. Commercials do not need to expect an immediate decline in gold to view current prices as attractive for increasing hedges.
The same mechanism is even more visible among Swap Dealers. This group holds only 19.1k long contracts against 243.8k shorts, implying a net short position of around 224.7k contracts. Over the week, shorts increased by a further 15.5k, while longs fell by around 1.7k. The scale of this move shows that futures supply from commercial participants is increasing alongside stronger activity from speculative buyers.
The divergence between funds and commercials is widening
If Producer/Merchant and Swap Dealers are combined into a broader commercial complex, the picture becomes even clearer. Together, the two groups hold around 34.8k long contracts and 287.4k shorts. Their combined net position therefore stands at roughly -252.6k contracts. Over the past week alone, this net short exposure increased by around 26k contracts.
At the same time, Managed Money is net long by around 137.7k contracts. This is a classic structure of a strong trending market, in which speculative capital buys momentum while commercials respond with increasing futures supply. This does not automatically mean that one side is right and the other is wrong. The two groups have very different objectives and operate over different time horizons.
Another important element of the report is the 28.8k increase in total open interest. The market is therefore not rising solely because earlier shorts are being closed, but is also attracting new exposure. This is an important distinction, because rising open interest alongside strong Managed Money positioning confirms the involvement of fresh capital in the trend. At the same time, it also increases the scale of potential future deleveraging if the market direction begins to reverse.
COT data points to rising positioning risk
The biggest mistake in interpreting this report would be to treat the large commercial net short position as a simple sell signal for gold. Commercials are structurally more likely to be on the short side because they hedge flows linked to the physical market or client exposure. During extreme phases of a bull market, their short positions can remain elevated for many weeks. The absolute level of positioning therefore does not provide reliable timing.
The pace of change is much more interesting. Managed Money continues to add longs, commercials are accelerating the build-up of shorts, and open interest is rising. Such a structure usually means that the trend remains active, but the market is becoming increasingly dependent on further inflows of speculative capital. If those inflows weaken, the earlier strength can quickly become a source of volatility.
The Other Reportables category provides additional confirmation of the one-sided setup. It holds 102.3k long contracts against 22.0k shorts, implying a net long position of around 80.3k contracts. This means that the bullish bias is not limited to Managed Money alone. A large part of the broader speculative segment remains positioned for further gains in gold.
Managed Money behaviour will be the key signal in upcoming reports
The current COT report does not yet show any clear capitulation among buyers. Managed Money is increasing exposure, short positions remain limited, and the broader speculative segment continues to hold a strong net long bias. From the perspective of positioning alone, the trend therefore remains confirmed. The risk is that an increasingly large share of market participants is already positioned on the same side.
A key warning signal would emerge if gold prices remained elevated while Managed Money started to reduce long exposure materially. An even stronger signal would be a simultaneous slowdown or decline in open interest. Such a combination would suggest that the market is no longer attracting fresh speculative exposure and that the existing trend is beginning to lose momentum. In that case, the current divergence between funds and commercials would take on a much more contrarian character.
For now, however, the main conclusion remains more balanced. Funds continue to confirm the upward trend, while commercials are using elevated prices more aggressively to hedge their exposure. This is not yet a signal that the bull market is ending, but it does show that the gold market is becoming increasingly crowded on the long side. The next two or three COT reports will therefore be particularly important in assessing whether Managed Money continues to build exposure or begins to gradually exit the market.
Source: CFTC



Daily Summary: SpaceX and the tech sector drive Wall Street, oil retreats sharply below $97


📉NATGAS loses 6% ahead of rollover


Russia is selling off gold reserves. Why, to whom, and does it matter for the market?

BREAKING: US oil inventories fall more than expected, but distillate build cools enthusiasm