
Goldman Sachs (GS.US) kicked off earnings season by joining other major banks in reporting their Q2 2025 results. Similar to other large U.S. banks with a significant investment banking presence, Goldman Sachs reported strong revenues, driven by a rebound in financial markets after April's sell-offs.
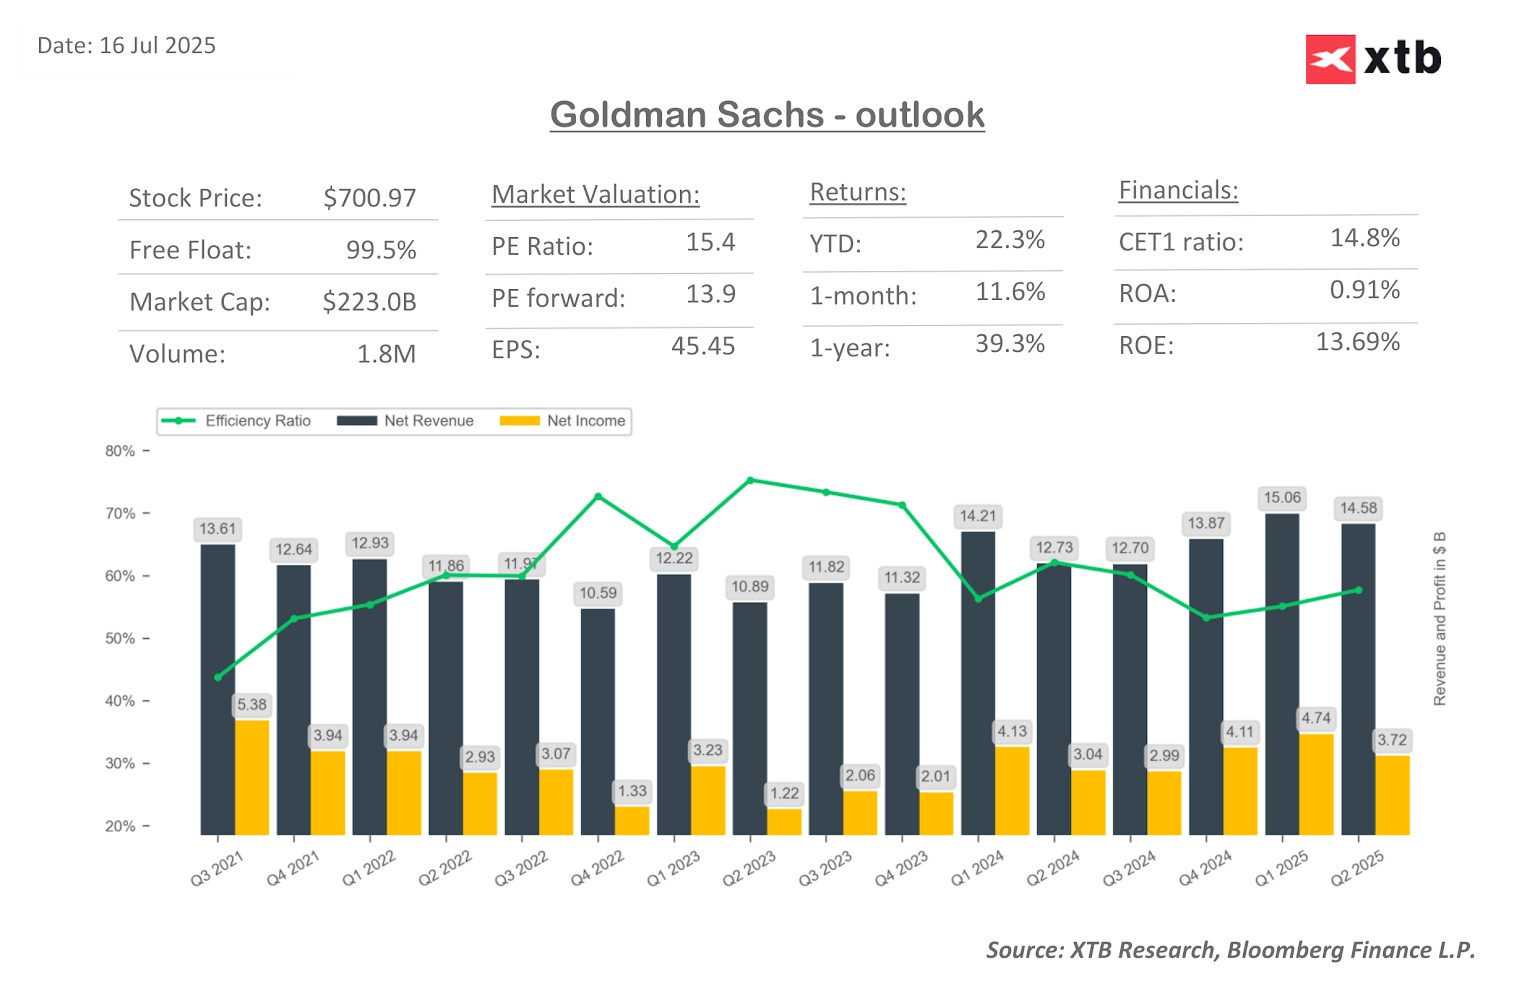
The company reported net revenues of $14.58 billion, a 15% increase year-over-year. Although this figure is lower than the previous quarter, it significantly surpassed estimates of $13.53 billion. The equities trading revenue segment showed the strongest momentum, rising by 23% year-over-year to $4.3 billion. This marks the best result in the company's history for this segment, largely driven by a 45% year-over-year increase in brokerage revenues.
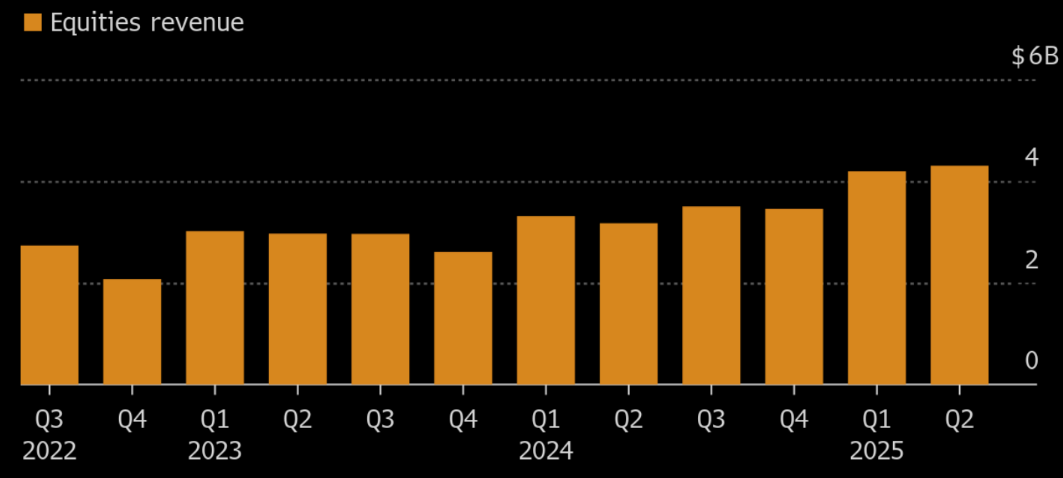
Goldman Sachs' equities trading revenue. Source: Bloomberg Finance L.P.
The company also achieved better-than-expected cost efficiency, reflected in a lower efficiency ratio (the percentage of costs to revenues) of 63.4%, compared to forecasts of 64.8%. This contributed to a higher net earnings per share (EPS) of $10.91, compared to $8.62 a year earlier.
Despite solid results, Goldman Sachs (similar to JP Morgan Chase) is trading down about -0.5% today. The market's reaction to the results remains neutral, with the prospect of strengthening earnings trends likely to offer long-term potential for the bank's growth rather than a short-term rebound.
Q2 2025 Results:
Revenues:
-
Net Revenue: $14.58 billion (+15% y/y); estimates: $13.53 billion
-
FICC Sales & Trading Revenue: $3.47 billion; estimates: $3.26 billion
-
Equities Sales & Trading Revenue: $4.30 billion; estimates: $3.72 billion
-
Global Banking & Markets Net Revenues: $10.12 billion (+24% y/y); estimates: $9.03 billion
-
Investment Banking Revenue: $2.19 billion (+27% y/y); estimates: $1.8 billion
-
Advisory Revenue: $1.17 billion (+71% y/y); estimates: $852.7 million
-
Equity Underwriting Revenue: $428 million (+1.2% y/y); estimates: $384.8 million
-
Debt Underwriting Revenue: $589 million (-5.3% y/y); estimates: $592.5 million
-
Net Interest Income: $3.10 billion; estimates: $2.43 billion
Earnings & Profitability Ratios:
-
EPS: $10.91 (vs. $8.62 y/y)
-
Adj. EPS: $10.91; estimates: $9.77
-
ROE (Return on Equity): +12.8%; estimates: +11.3%
-
Efficiency Ratio: 63.4%; estimates: 64.8%
Costs & Losses:
-
Platform Solutions Pretax Loss: $57 million; estimates: $85.6 million loss
-
Provision for Credit Losses: $384 million (+36% y/y)
-
Total Operating Expenses: $9.24 billion (+8.3% y/y)
Balance Sheet:
-
Total Deposits: $466 billion (-1.1% q/q)
-
Standardized CET1 Ratio: 14.5%; estimates: 14.7%
-
Book Value Per Share: $349.74 (vs. $327.13 y/y)
-
Assets Under Management: $3.29 trillion (+12% y/y)
-
Total AUS Net Inflows: $5 billion (-93% y/y)
-
Loans: $217 billion; estimates: $211.09 billion

Daily Summary: Equities Diverge as Tech Lags, Europe Rallies on Earnings & PMIs (24.07.2026)

US OPEN: Nasdaq hits 1-month low! Geopolitics bring AI trade down!

Market Wrap: European Stocks Are Trying to Rebound as the Week Comes to an End💡

Alphabet shares are down 22% from their all-time high 🚩 Is Google ready to resume its bull run?