
The GBP/USD recovered from a weekly low of 1.3785 and hit a fresh weekly high of 1.3986. The pound was supported by comments from the UK Health Minister Matt Hancock, who is confident the country can fully end lockdown on July 19. In addition, the last PMI report for June showed overall business activity expanding at the quickest pace on record showing strong growth in both services and manufacturing. GBP started the session as the best performing major currencies but NZD took the lead.
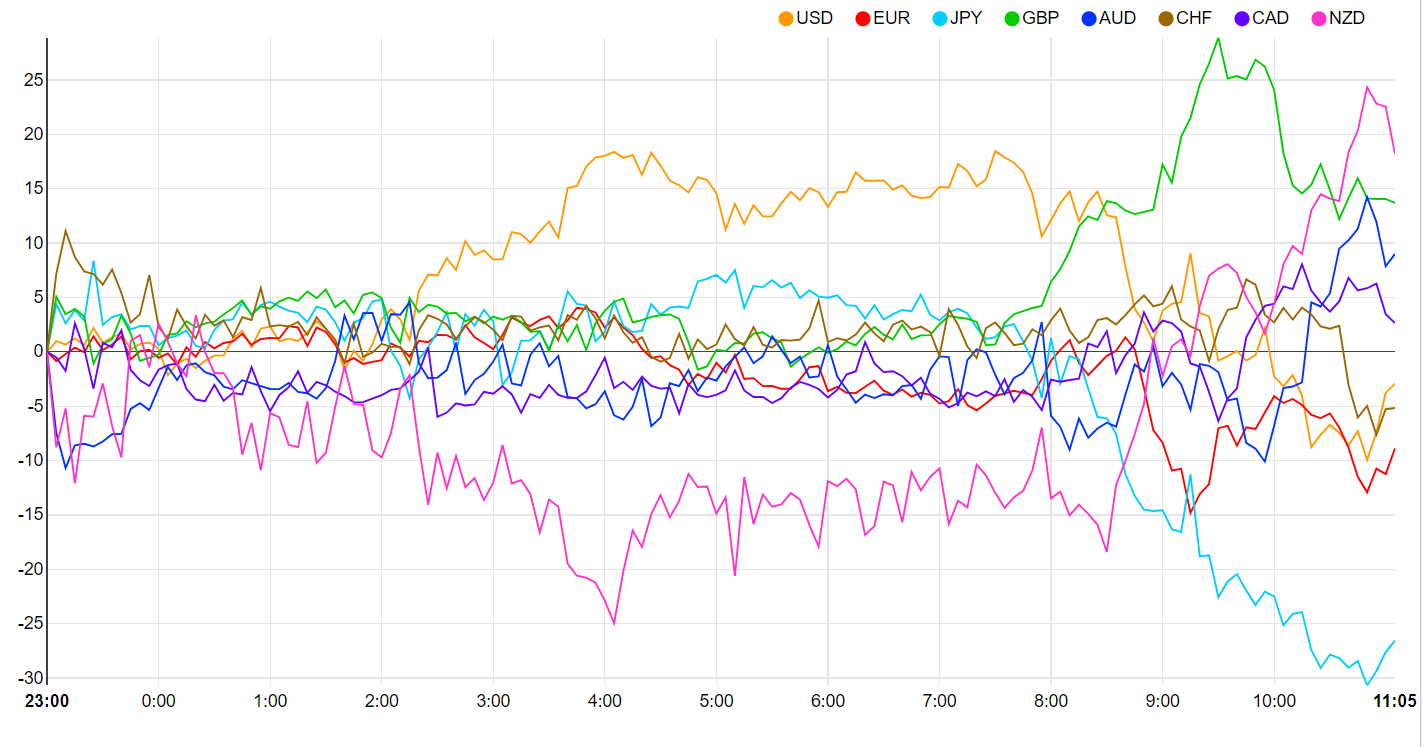
Source : currency-strength.com/
Daily interval :
GBPUSD continues to recover from a recent decline. The pair bounced off the 1,3790 support on monday and climbed above a lower limit of the Ichimoku cloud at 1,3950. The upward move slowed down near the key resistance level at 1,3990, which is marked by the tenkan-line (red line). Looking at the broader picture, we can notice that GBPUSD draws a double top pattern below the resistance zone ranging below 1,4210. If sellers manage to halt the upward move and break below the aforementioned weekly low, the decline could deepen to the neckline of the double top pattern at 1,3685. Breaking down the neckline would be a technical bearish signal. On the other hand, if GBPUSD breaks above the Ichimolu cloud, a move towards 1,41 is possible.
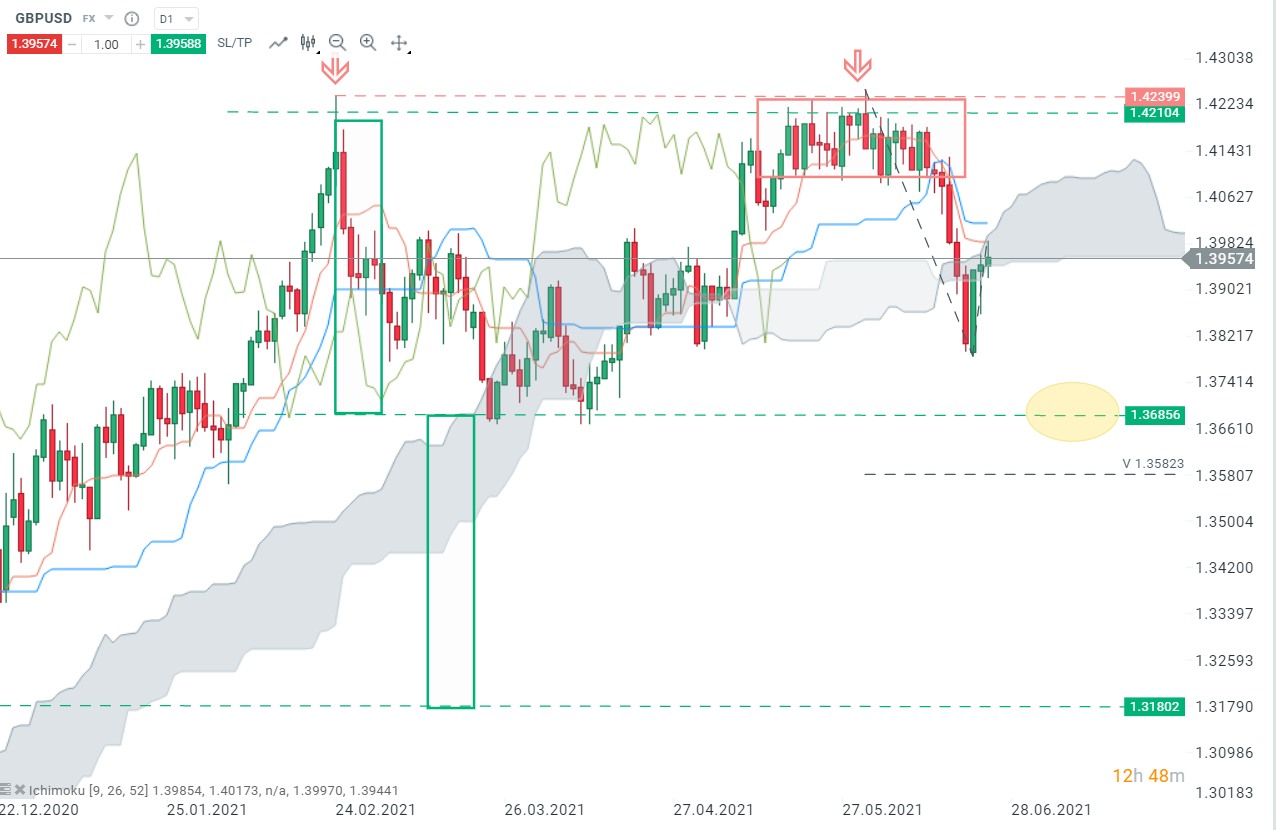
GBPUSD, D1 interval, Source : xStation5
H1 interval :
On a H1 time frame, one can see that the upward move started after the pair breaks above the neckline of the inverted SHS pattern. Bullish perspectives had been reinforced by a Ichimoku signal when GBPUSD broke above the Ichimoku cloud. The next resistance can be found at the SMA 200 at 1,40000. If buyers manage to push the price above this moving average, a move towards resistance at 1.4088 may be on the cards. The next support can be found near the neckline at 1,3920 reinforced by the kijun-line (blue line).
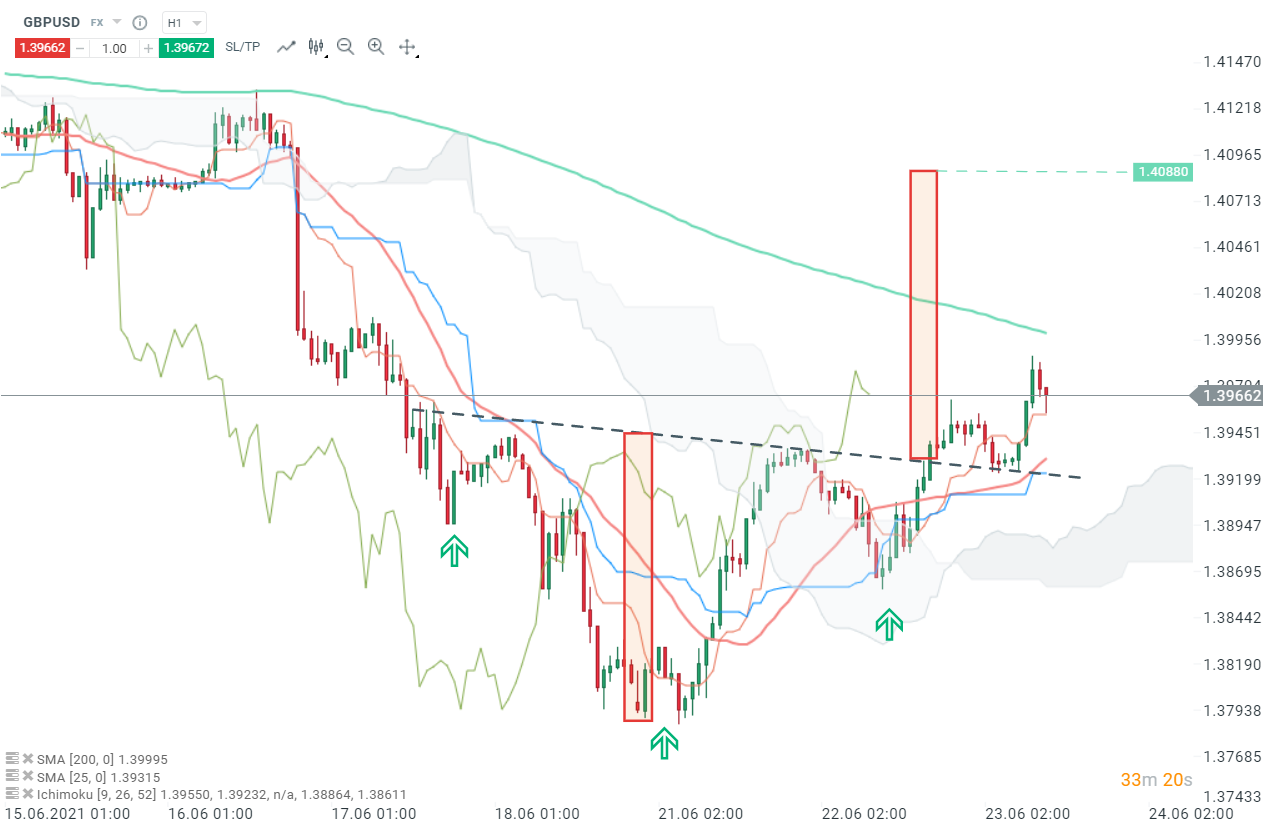
GBPUSD, H1 interval, Source : xStation5
Réda Aboutika, XTB France
Delays at Nvidia: Is the Kyber project at risk?

The defense industry is recouping losses - is this a trend change?
"Rammmagedon” ends up in court: Antitrust lawsuit and investments in Korea

Apple Price Hikes: Memory costs weigh on the company’s and markets