
- What's next for the Ethereum price❓
- What's next for the Ethereum price❓
On the D1 chart, Ethereum prices clearly moved upwards during yesterday's session. The price managed to break through the key short-term resistance, i.e. the average of the last 100 periods, marked on the chart with a blue line. If the price remains above this average, a move towards resistance at $3,544 is possible, where the upper limit of the 1 to 1 geometry is located. Breaking through this level could pave the way for further gains. On the other hand, a rapid return of the price below the 100-period average could result in a renewed downward movement towards the support zone at $2,850.
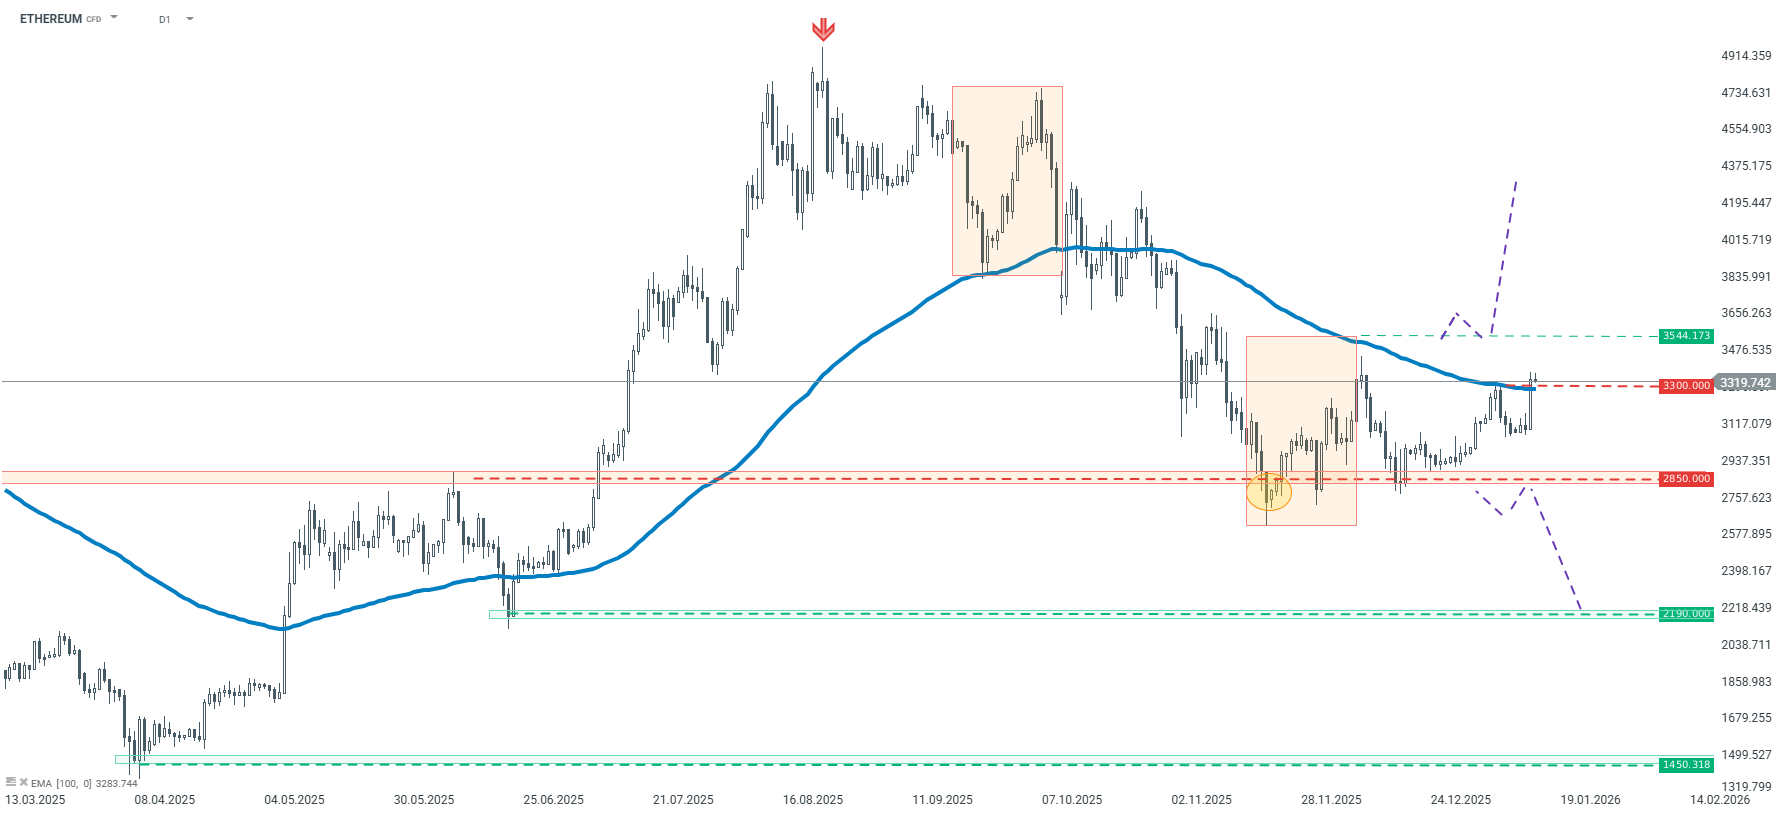
Ethereum – D1 interval | Source: xStation 5
On the lower H4 interval, in line with yesterday's analysis, the upward scenario began to materialise after rebounding from the support zone at $3,075. Despite the earlier breach of local geometry, the price managed to set a new high, which suggests a local upward trend since mid-December. For this to be negated, the price would have to return below $3,075, which is not the baseline scenario at this point.
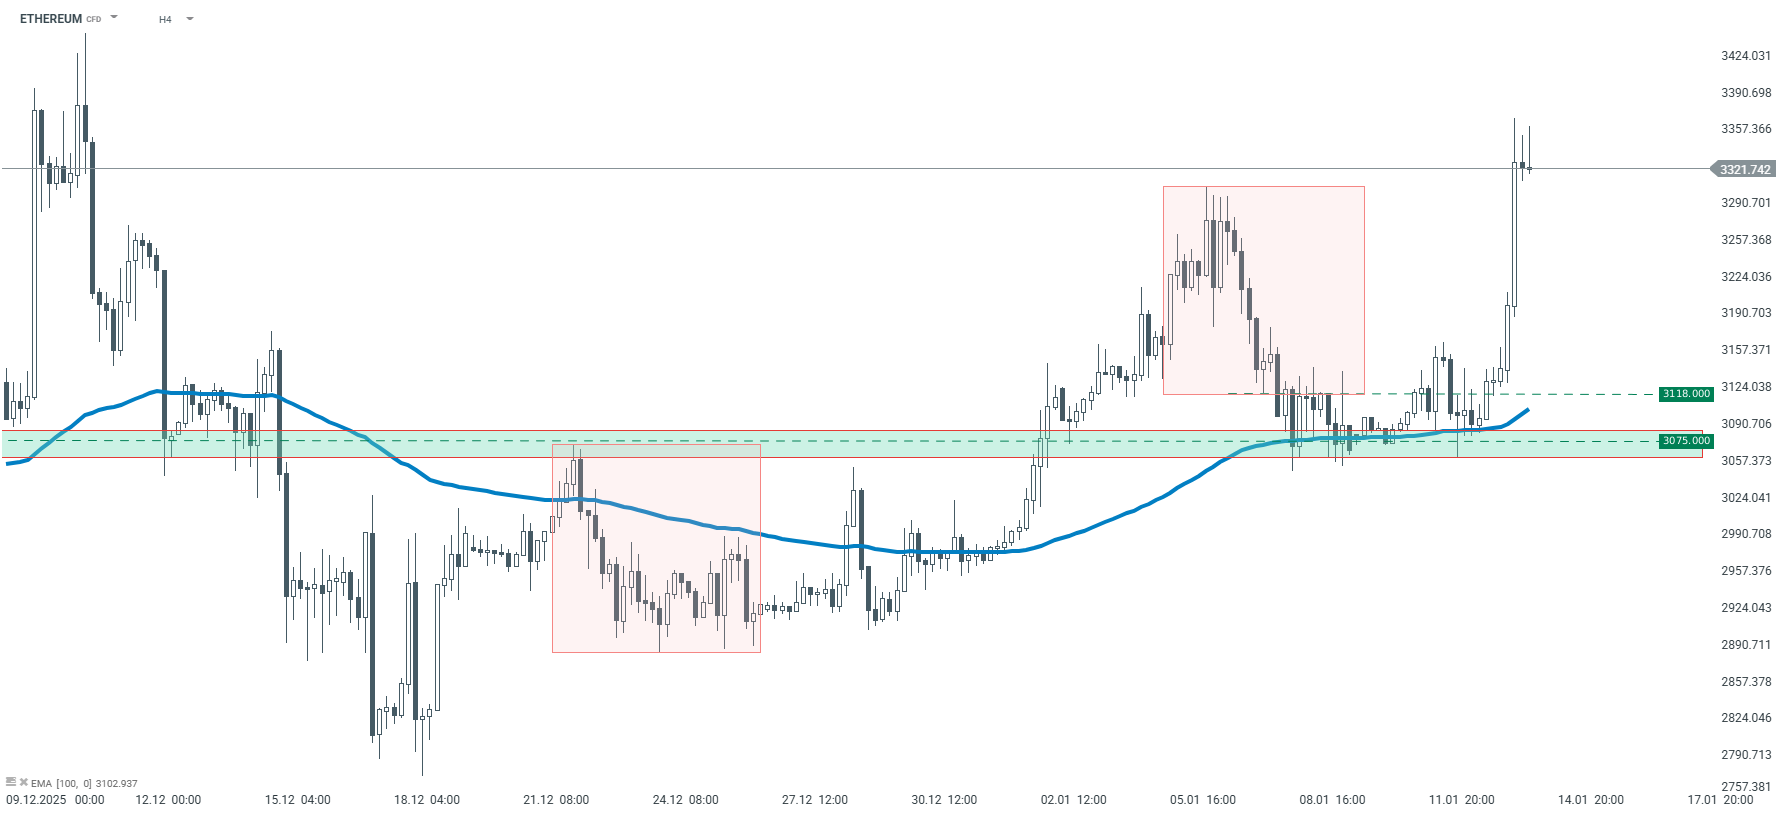
Ethereum – H4 interval | Source: xStation5

Daily Summary: Wall Street Regains Ground; Another Intervention in the Yen Market❓

Three Markets to Watch Next Week (July 31, 2026)

Market Wrap: European equities at 3-week highs! Apple dips in US premarket!

Euro Area core inflation above estiamtes! EURUSD under key resistance!