
The japanese index (JAP225) fell nearly 1.40%, following Wall Street's decline. Investors are also concerned about the Bank of Japan's absence of ETF purchases in Tuesday's session, during which the Nikkei experienced its biggest drop since February 26.
Another factor that hurt the market was SoftBank, which fell 2.76% after a news report that the group is expected to announce a record annual net loss after the close
In this analysis on NIKKEI (JAP225), we will focus on three intervals - weekly, daily and H4 - to find out the perspectives for the japanese index.
Weekly interval :
When we look at the weekly time frame, we can see that the NIKKEI (JAP225) has been under pressure in recent months. During this week, NIKKEI was impacted by techs sell-off which caused prices to fall near the Kijun-line (blue line). Closing under this line may announce a deeper decline.
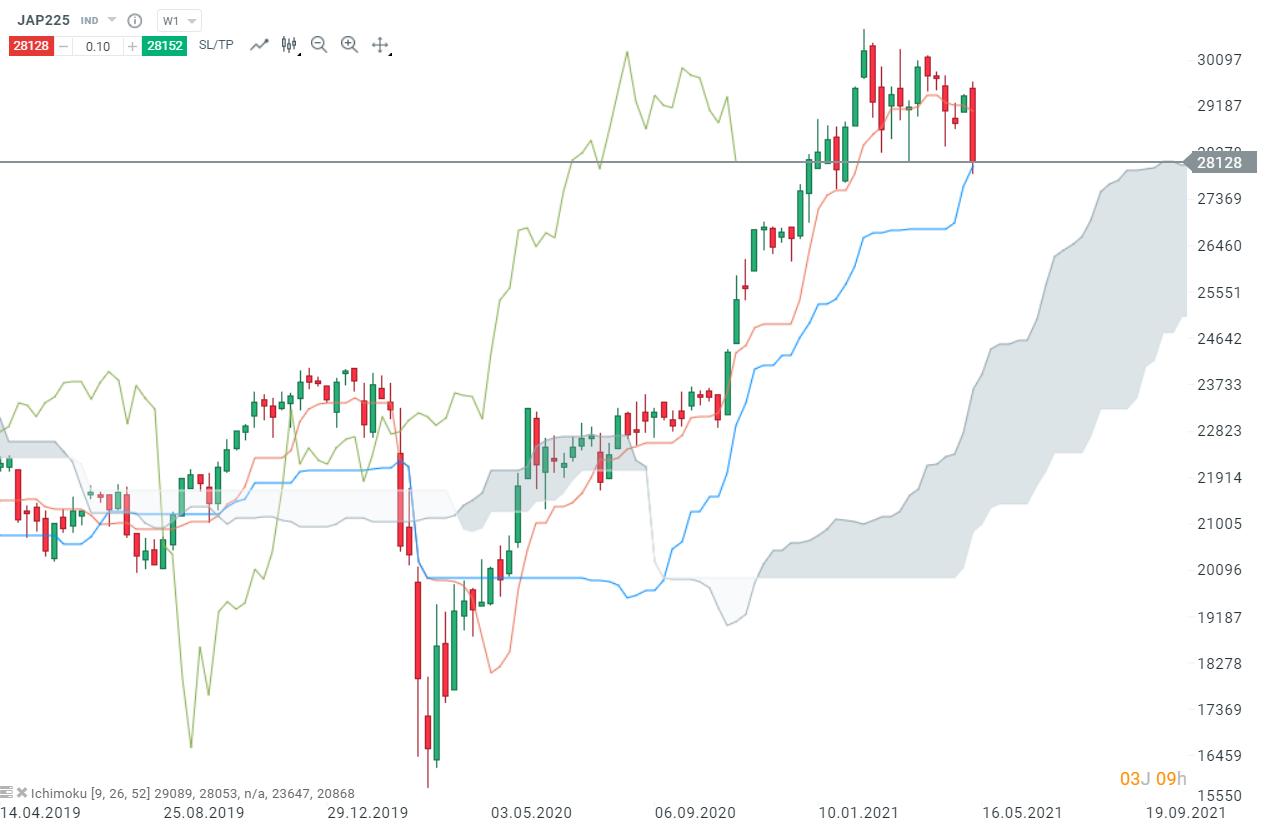
NIKKEI (JAP225), W1 interval, Source : xStation5
Daily interval :
NIKKEI (JAP225) plunged yesterday as tech shares sold off, leading the japanese indexe to break under the lower limit of the triangle. The downward move resumed today and the Chikou-span broke the lower limit of the Ichimoku cloud (red box), confirming the bearish signal. If bears manage to break 27 550 pts support, the next support can be found at 26 640 pts.
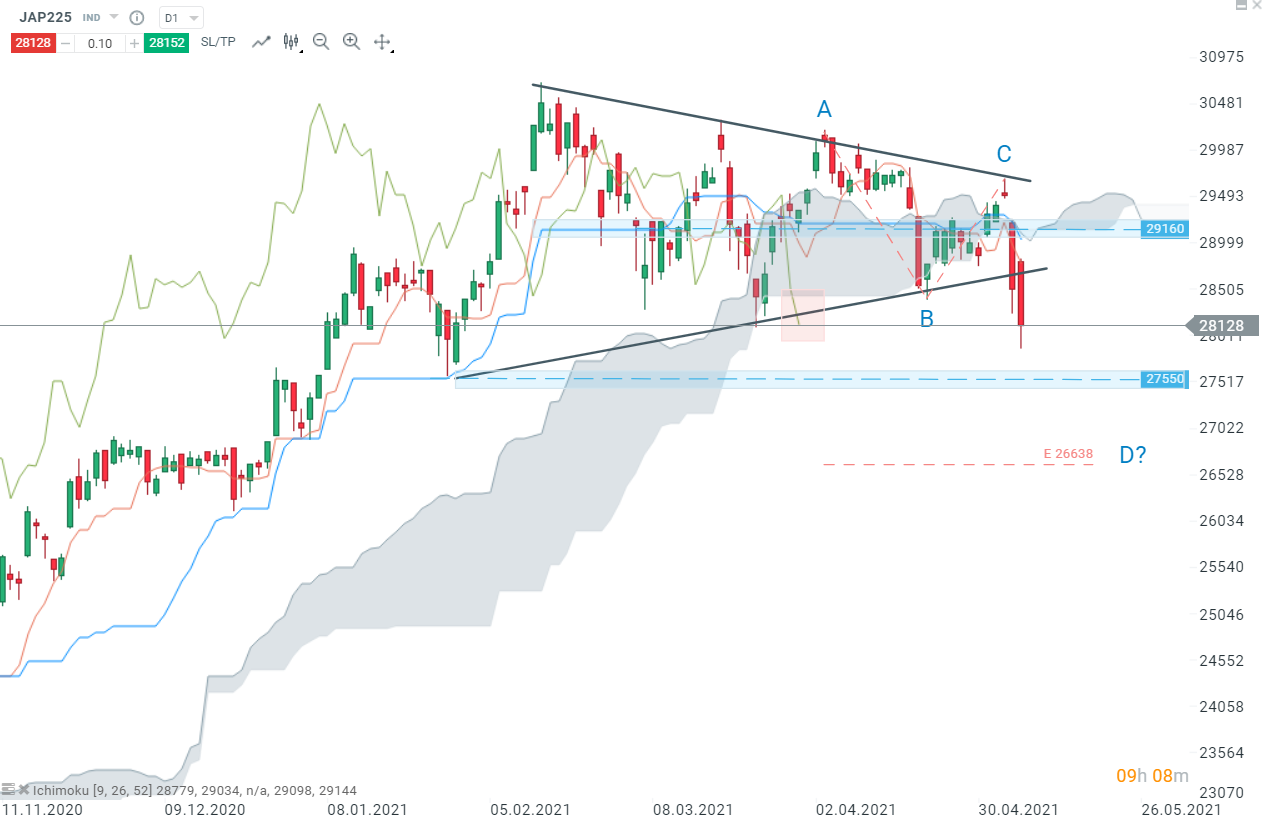
NIKKEI (JAP225), D1 interval, Source : xStation5
H4 interval :
After breaking through the cloud (major Ichimoku bearish signal), prices collapsed to significant support marked by previous price reactions. If the hourly candlestick manages to close below this support (green area), the decline could deepen. Next support can be spotted on the daily chart at 27 550 pts. In the other hand, if prices rise, the next resistance can be found at 28 780 pts (blue area) wich coincide with the Kijun-line (blue line).
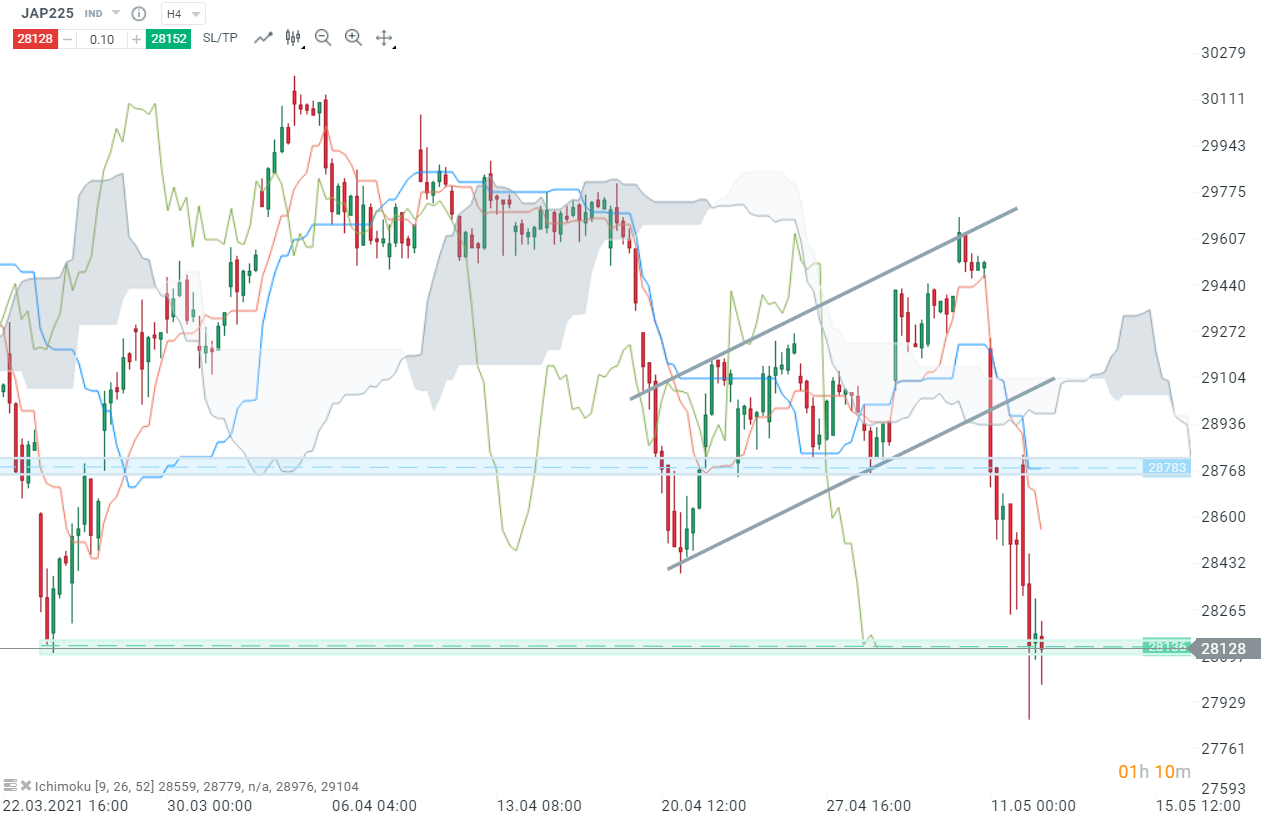
NIKKEI (JAP225), H4 interval, Source : xStation5
Réda Aboutika, XTB France
Market Wrap: Bulls Return to Europe Thanks to U.S.-Iran Mediation and Data from Germany

Chart of the day 🔼Nasdaq gains 1.2% as semiconductors rebound (21.07.2026)

Morning wrap: Indices Look for a Rebound Amid the U.S.-Iran Conflict (21.07.2026)

Market Wrap: Airlines Under Pressure, Europe Resists Expensive Oil