
After a new high around $71.35, OIL has been trading under pressure as of late. On a daily time frame, OIL painted a Dark-cloud cover (red box), a dual-candle pattern that is a top reversal after uptrend. Today, prices are trying to break an important support at 66,75$, the tenkan-line of Ichimoku. If sellers manage to break this support, the next support will be the kijun-line (blue line) at 64,40$.

OIL D1 interval. Source : xStation5
On hourly interval, OIL painted a reversal head and shoulder pattern which allowed prices to break the downside of the Ichimoku cloud after breaking the neckline. Breaking the downside of the cloud is a bearish signal and the confirmation will come from the chikou-span (green line), representing closing prices 26 periods in the past. If the chikou-span manages to fall under the cloud (green box), the bearish signal will be confirmed and the decline could deepen to the target of the SHS patter near $64.40, which coincides with the daily Kijun mentioned above.
From now, buyers are trying to take control of the market, which leads prices to an important support at $67.90 - the H1 kijun-line (blue line). As long as the price sits below the $67.90 resistance one should expect the price to continue to fall.
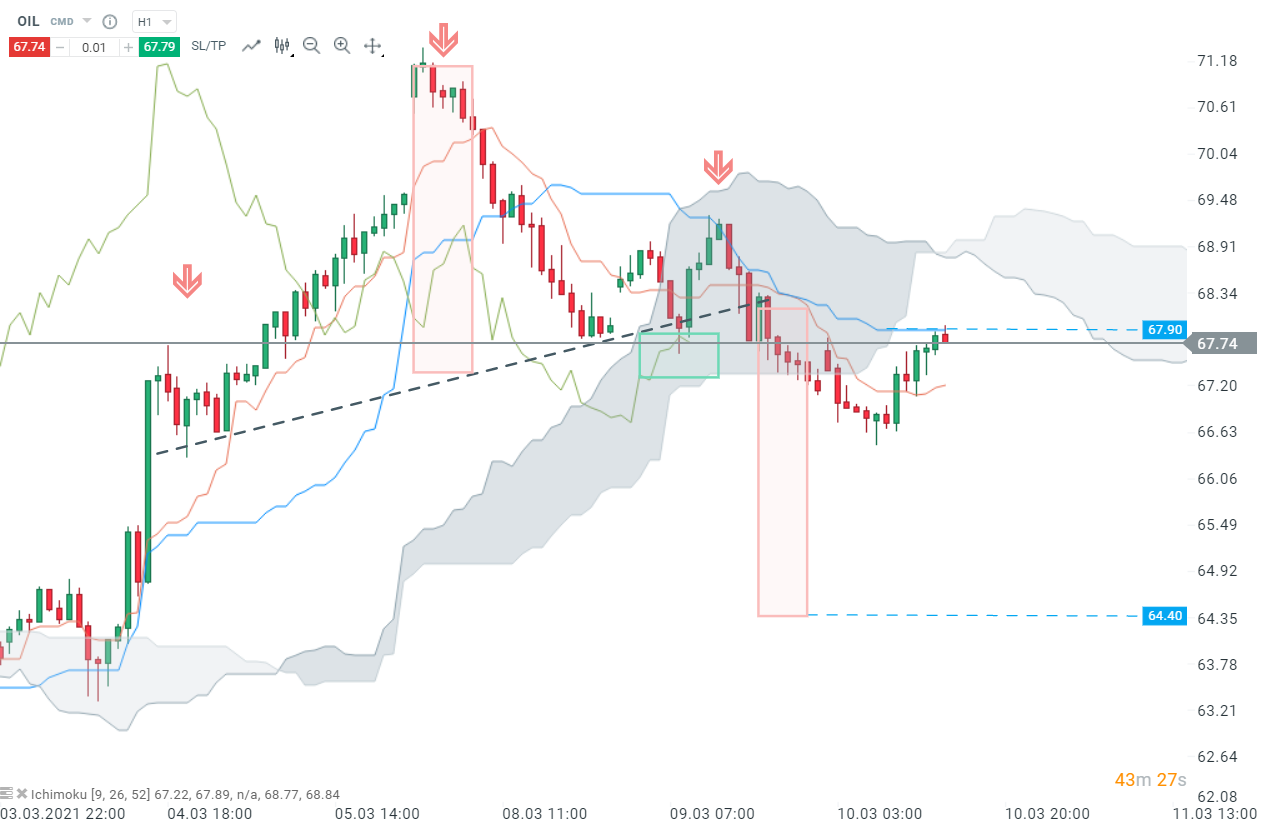
OIL H1 interval. Source : xStation5
Keep in mind that prices are located above the cloud in the daily time frame, so the main trend remains bullish. Breaking the H1 cloud only means that a short-term correction may occur.
When it comes to fundamentals, release of the DOE report on weekly stocks will be decisive and could lead to a realisation of the main scenario. In other cases, prices could break the H1 kijun mentioned above and rise to the next support- the Ichimoku cloud. Indeed, the cloud is often an area of support or resistance depending on the relative location of the price.

Daily Summary: Wall Street Regains Ground; Another Intervention in the Yen Market❓

Three Markets to Watch Next Week (July 31, 2026)

Market Wrap: European equities at 3-week highs! Apple dips in US premarket!

Economic Calendar: Key European CPI Readings and Oil Giants’ Earnings