
JPMorgan Chase kicked off the earnings season with a mixed signal, leaving the stock flat in the premarket trading (currently at around $325). The bank capped a record 2025 with its highest-ever annual revenue of $182 billion, despite a fourth-quarter profit hit from its strategic takeover of the Apple Card portfolio.
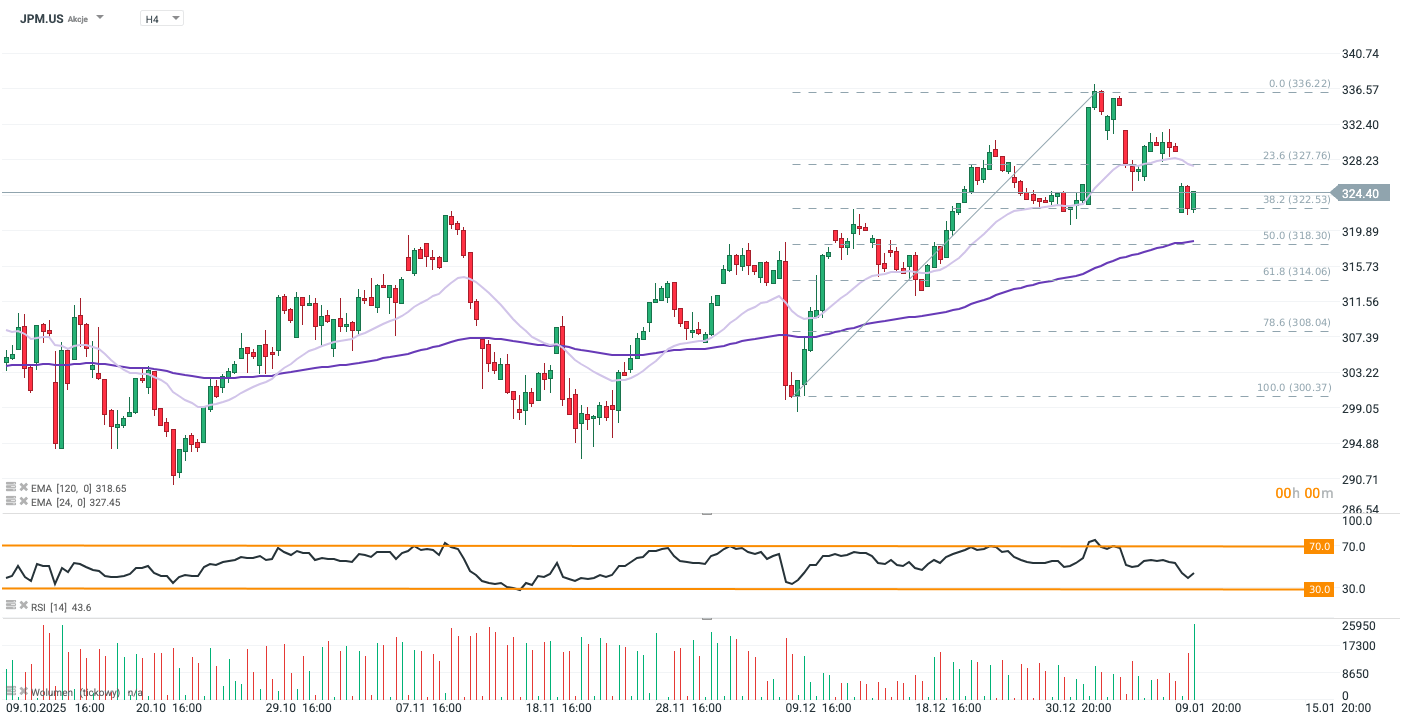
JPM stock has retreated to the 38.2% Fibonacci retracement level, weighed down by pre-earnings caution and President Trump’s recent comments on credit rate caps. The decline broke through immediate support around $330—a key level coinciding with the 30-day Exponential Moving Average (EMA30). This breach suggests that a quick return to recent highs is unlikely, potentially setting the stage for a deeper bearish test of the 100-day moving average (EMA100). Source: xStation5
Caution despite many beats
The bank reported Q4 net income of $13 billion, down 7% from the previous year. However, excluding the $2.2 billion provision for the Apple deal, EPS of $5.23 comfortably beat Wall Street's $4.85 forecast. (total EPS: $4.63). CEO Jamie Dimon cited a "resilient" economy but warned of "sticky inflation" and geopolitical hazards.
Shares initially rose 1% after volatility from President Trump’s proposed credit card rate caps, as the bank issued strong 2026 guidance projecting $95 billion in net interest income. Nevertheless, the overall EPS miss and premium-client-driven performance spark caution among investors, in spite of Jamie Dimon’s optimism regarding the U.S. economy, bringing stock’s premarket down to around 0.15-0.2%.
Top Line Results
-
Net Income: $13.03 billion, down 7% y/y.
-
EPS (Earnings Per Share): $4.63, down 4% y/y.
-
Note: EPS was $5.23 excluding significant items.
-
-
Adjusted Revenue: $46.77 billion vs. Estimate $46.35 billion. (BEAT)
-
Managed Net Interest Income: $25.11 billion (+7% y/y) vs. Estimate $24.99 billion. (BEAT)
Trading & Banking Highlights
-
Equities Sales & Trading: $2.86 billion (+40% y/y) vs. Estimate $2.7 billion. (BEAT)
-
FICC Sales & Trading: $5.38 billion (+7.5% y/y) vs. Estimate $5.27 billion. (BEAT)
-
Investment Banking Revenue: $2.55 billion (-1.9% y/y) vs. Estimate $2.65 billion. (MISS)
-
Note: Both Equity and Debt underwriting revenues missed estimates, with Equity underwriting down 16% y/y.
-
Credit & Balance Sheet
-
Provision for Credit Losses: $4.66 billion (includes Apple Card reserves) vs. Estimate $4.68 billion.
-
Net Charge-Offs: $2.51 billion vs. Estimate $2.56 billion. (BETTER THAN FEARED)
-
Assets Under Management: $4.79 trillion vs. Estimate $4.73 trillion.

Meta Announces Its Own AI Chips. Is the Era of Full Dependence on NVIDIA Slowly Coming to an End?

Vodafone shares surge 13% after Xavier Niel's £4.4 billion investment. What's next for the stock?

🚩 Apollo Global warns on AI: Has the market become too optimistic?

Stock of the Week: Seagate Technology. How an old technology found a new role in the era of artificial intelligence