
Today's trading on the oil market started with an upward move. However, buyers did not manage to break above the resistance at $53.25 and a dynamic reversal could be observed afterwards. Looking at the M15 interval, one can see the head and shoulders formation may be building up. In case the price breaks below the zone at $52.55, a larger downward move may follow. In case of such a scenario, the first noteworthy support can be found at $51.55. However, traders should keep in mind that long-term trend is bullish and as long as the price sits above $52.55, buyers seem to be in advantage.
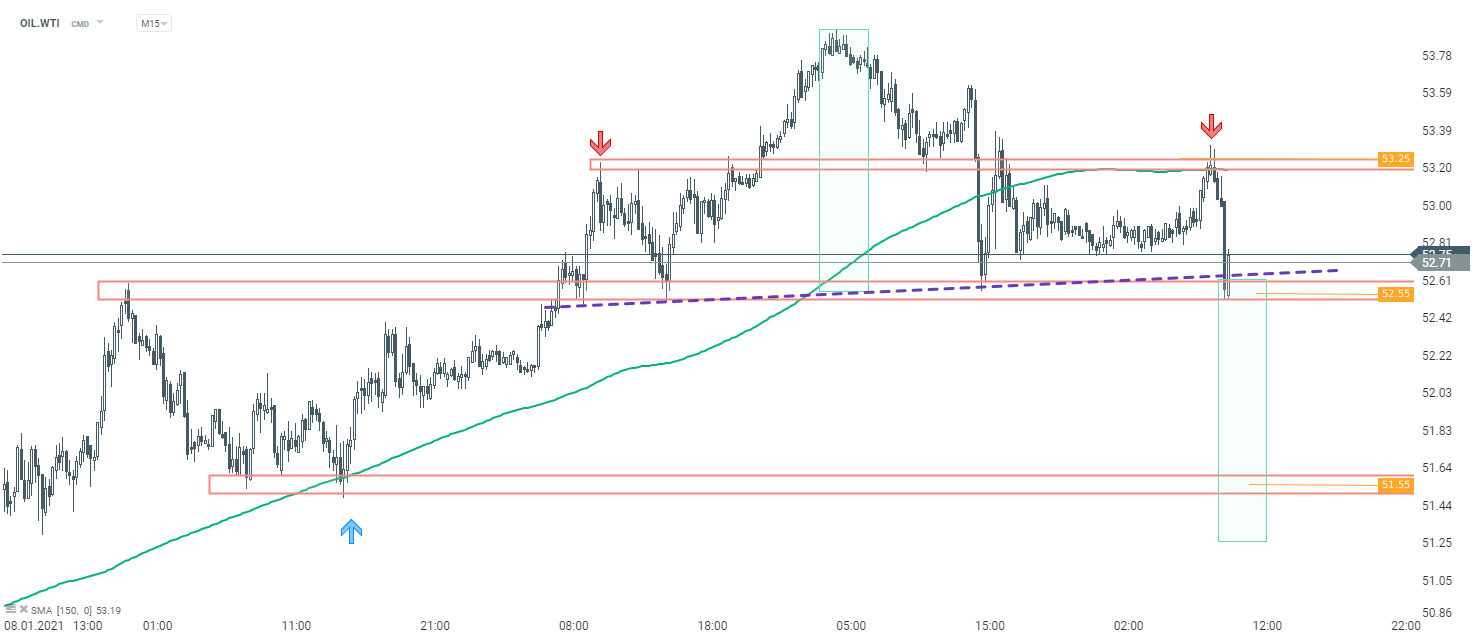 OIL.WTI M15 interval. Source: xStation5

Daily Summary: Wall Street Regains Ground; Another Intervention in the Yen Market❓

Three Markets to Watch Next Week (July 31, 2026)

Market Wrap: European equities at 3-week highs! Apple dips in US premarket!

Economic Calendar: Key European CPI Readings and Oil Giants’ Earnings