
-
US Gas Hits $5 (Highest since 2022): The sharp price surge in the US, breaching $5/MMBTU, is driven by strong heating demand due to colder North American weather and persistent high LNG exports.
-
Unusual Inventory Draw: An exceptionally large implied US inventory draw (200 bcf), typically seen only in deep winter (Jan/Feb), suggests overvaluation at the short end of the forward curve (backwardation).
-
Transatlantic Divergence: Europe remains unfazed (low prices despite lower inventories), creating a significant price gap with the US market. This European stability may limit further US upside in the longer term.
-
US Gas Hits $5 (Highest since 2022): The sharp price surge in the US, breaching $5/MMBTU, is driven by strong heating demand due to colder North American weather and persistent high LNG exports.
-
Unusual Inventory Draw: An exceptionally large implied US inventory draw (200 bcf), typically seen only in deep winter (Jan/Feb), suggests overvaluation at the short end of the forward curve (backwardation).
-
Transatlantic Divergence: Europe remains unfazed (low prices despite lower inventories), creating a significant price gap with the US market. This European stability may limit further US upside in the longer term.
Natural gas prices recorded a significant surge in November, with the impact of the recent futures contract rolling being marginal on the previous month's price action. Following two mixed sessions at the start of December, strong gains on Wednesday led to a breach of the March 2025 peaks, with prices currently trading at their highest level since 2022, briefly crossing the $5/MMBTU threshold. What is driving this robust price increase, and what can be expected in the near future?
The US Winter Onslaught
Low temperatures in recent weeks have caused US gas consumption to clearly rise above standard norms. Gas consumption is currently at its highest level for this period in five years, although it remains short of the record-high consumption levels observed during the first two months of the current year (the green line on the first chart below). While gas usage by power plants is substantial (second chart), the primary driver of increased consumption is heating demand, resulting from lower-than-average temperatures. Both near-term and full-season forecasts indicate colder temperatures across the northern part of the United States.
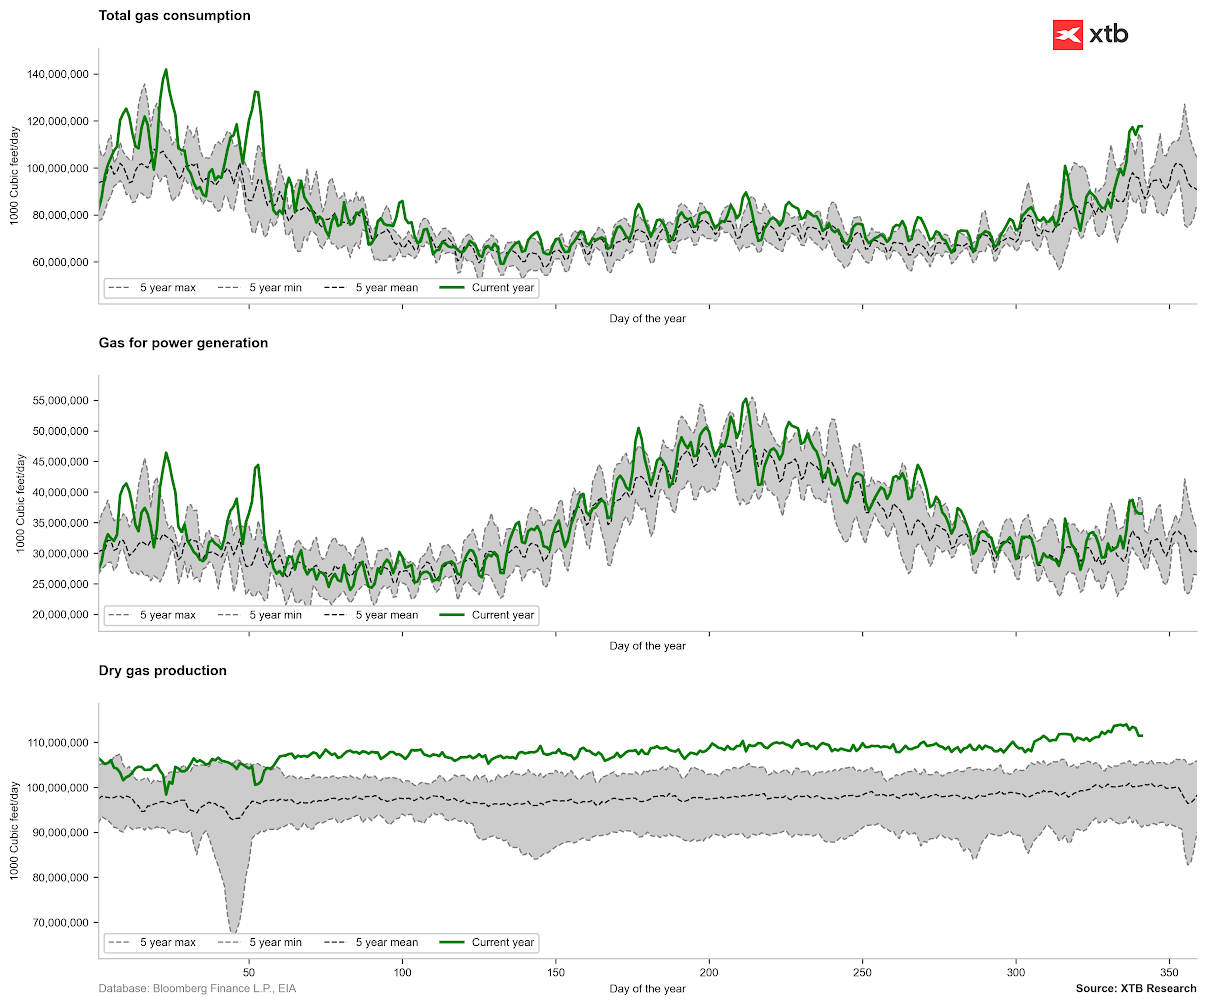
High gas consumption in the USA. Source: Bloomberg Finance LP, XTB
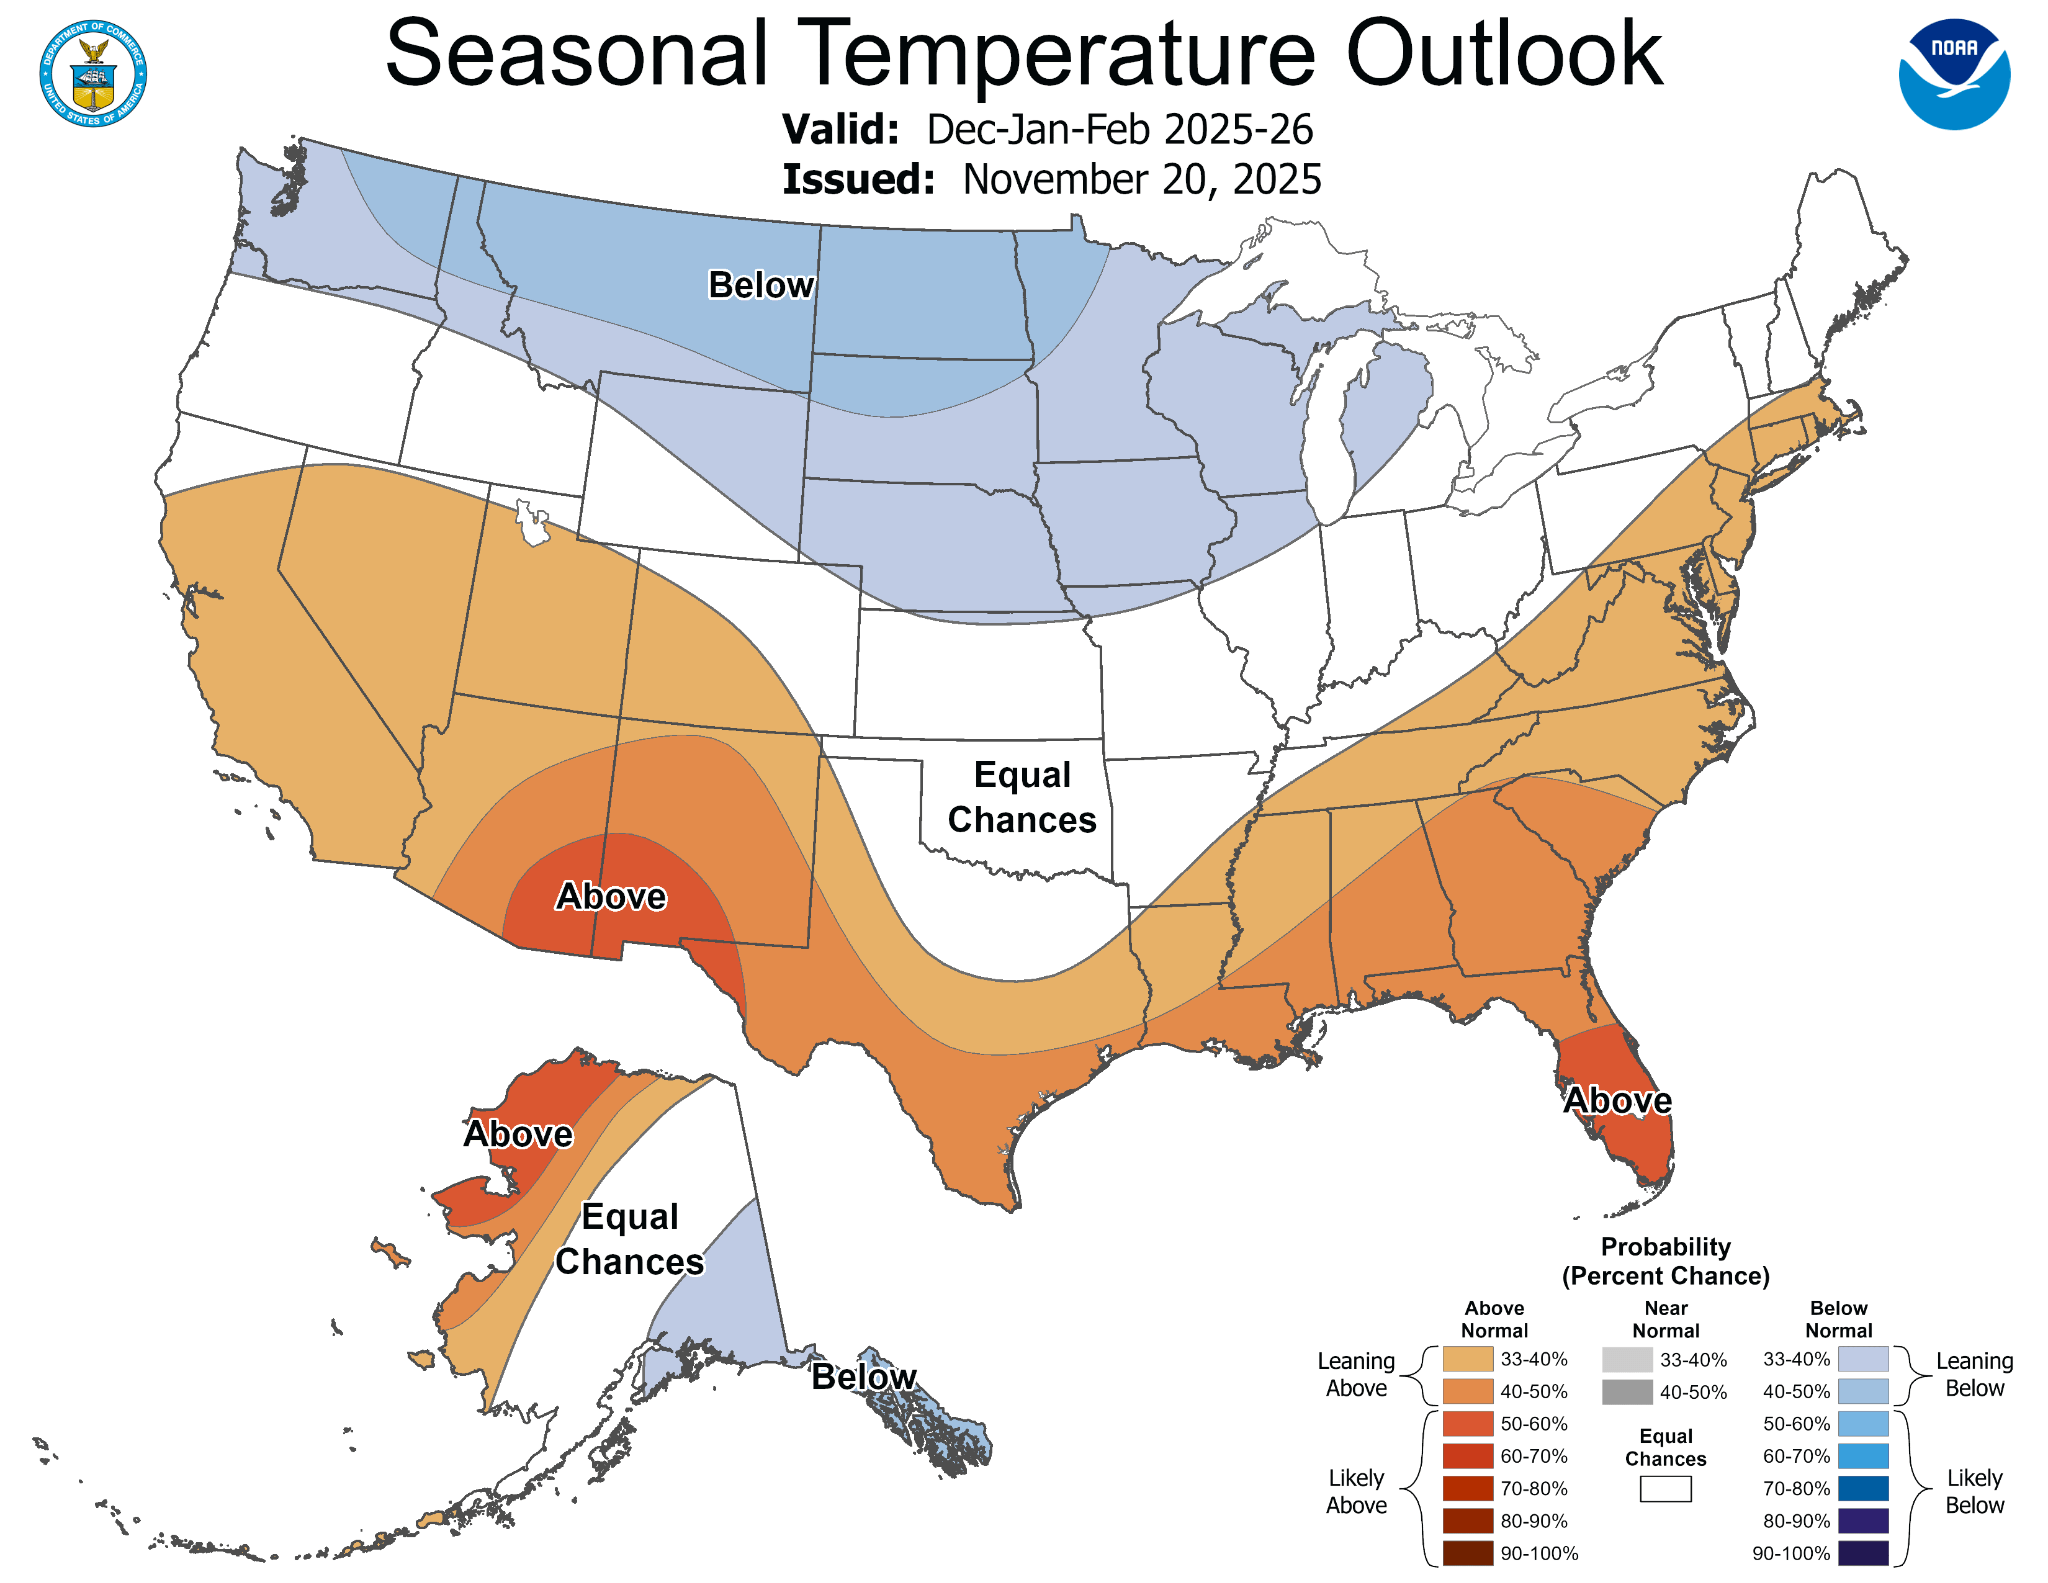
Temperatures in the northern United States are expected to be colder during the winter season, although they do not deviate extremely from the average. Weather forecasts may change soon, especially as temperatures in the south are notably higher than standard. Source: NOAA
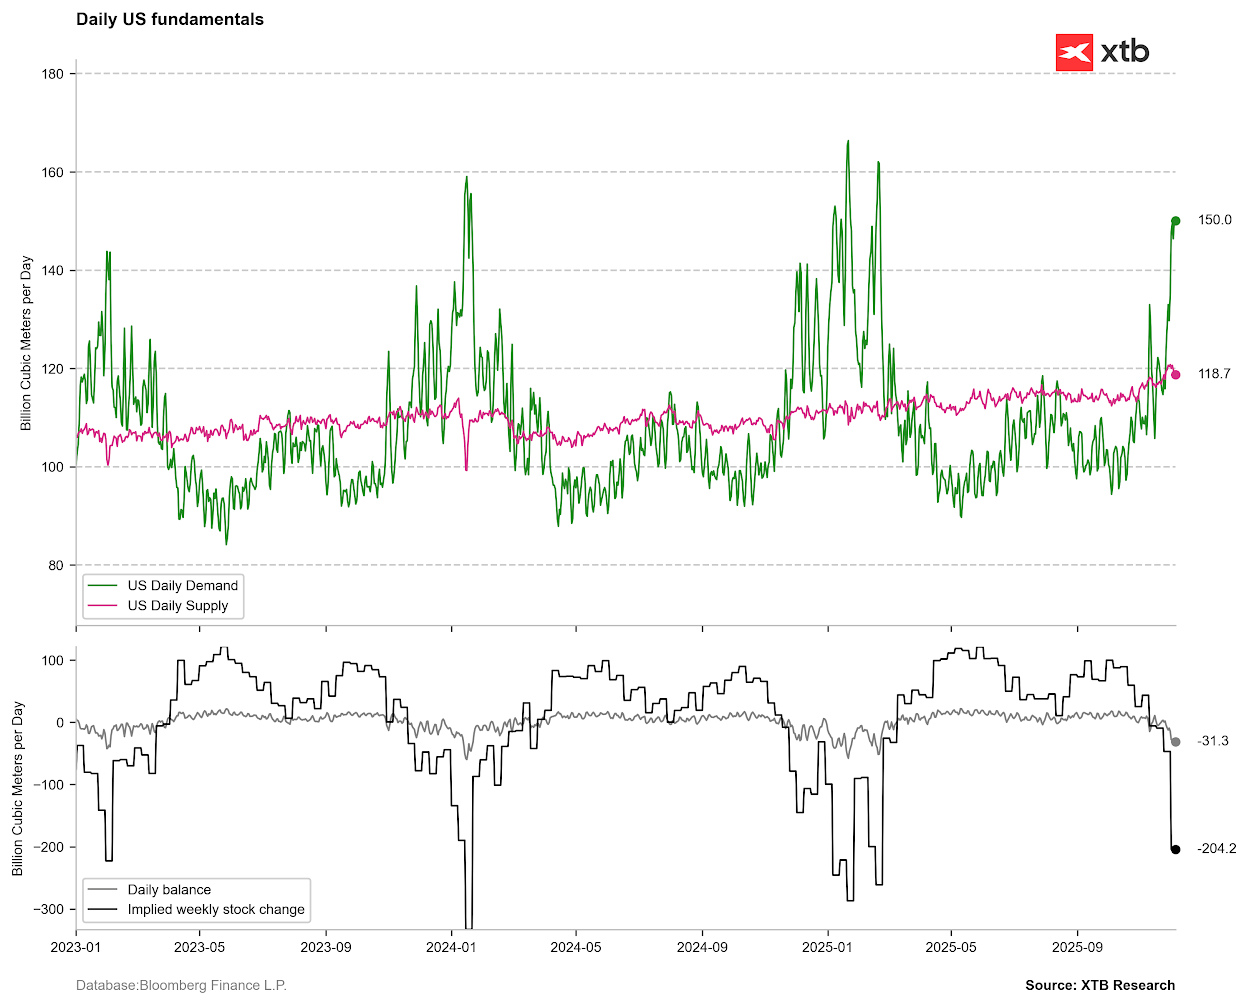
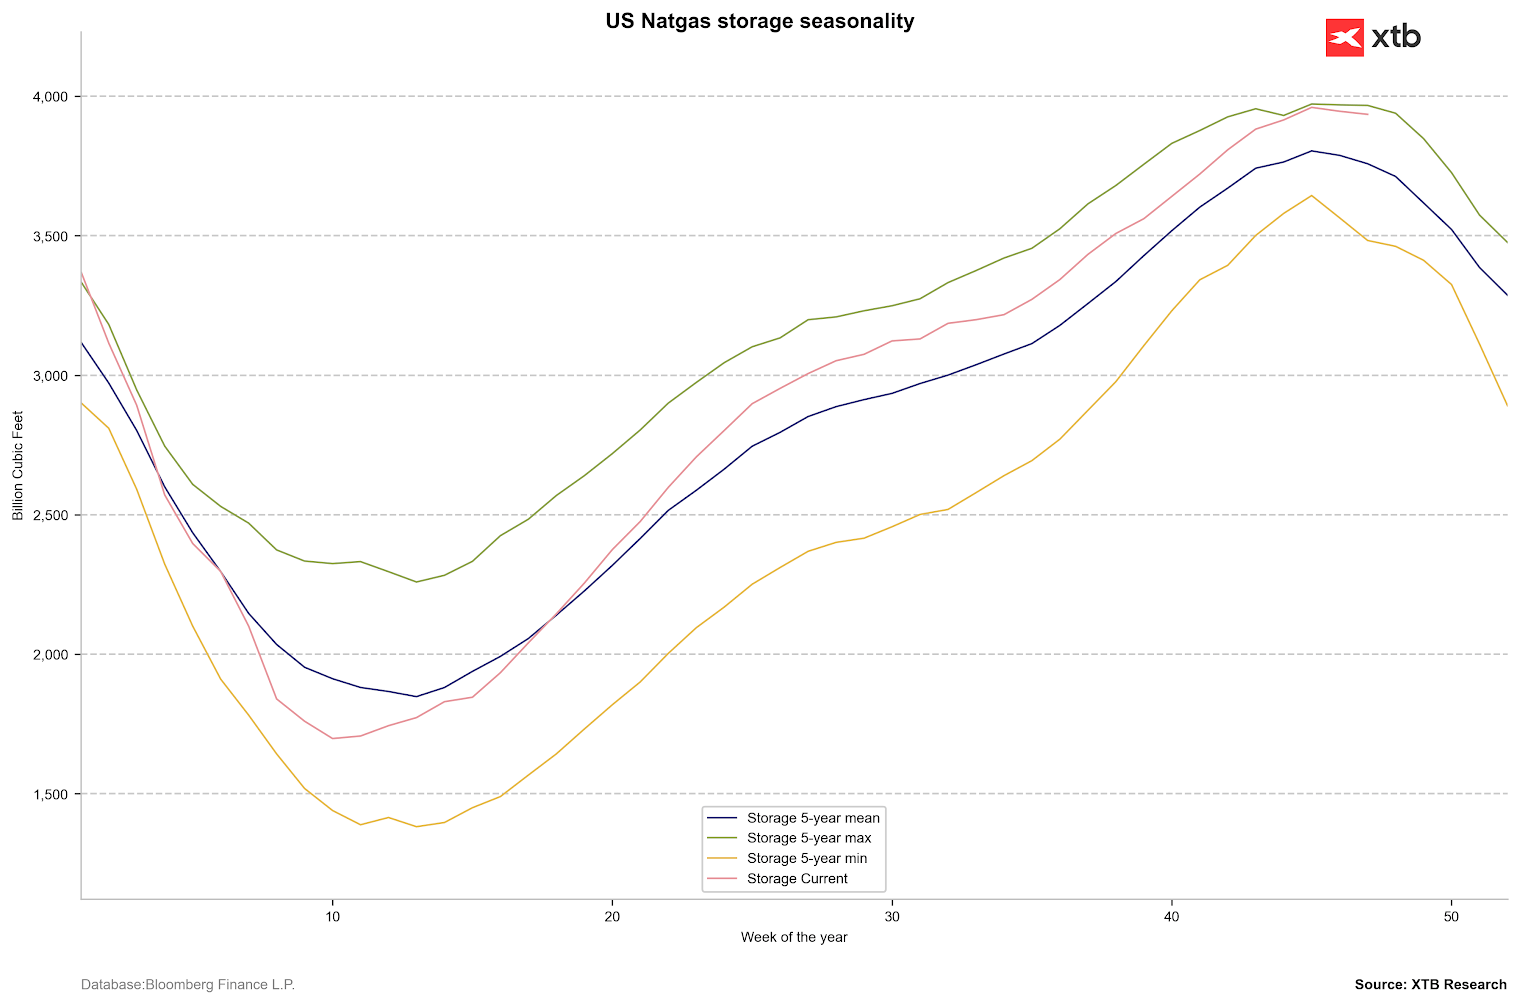
Nevertheless, the cold temperatures have led to a sudden surge in demand. Furthermore, LNG exports remain very high, close to 100% of pipeline capacity. Even with very high supply, which has exceeded 120 billion cubic feet per day (bcfd), the implied change in inventories points to a stock draw of 200 bcf, which is highly unusual for this time of year. Typically, such large drawdowns occur in January or February. Source: Bloomberg Finance LP, XTB
Europe Unfazed by Winter, Despite Lower Inventories
We are currently observing an interesting divergence between price behaviour in the US and Europe. US prices are rising sharply, driven not only by the shape of the forward curve but also by surging short-term demand. Simultaneously, however, inventories in the US remain at a relatively high level, near 5-year maximums, and comparative inventories do not justify such elevated price levels.
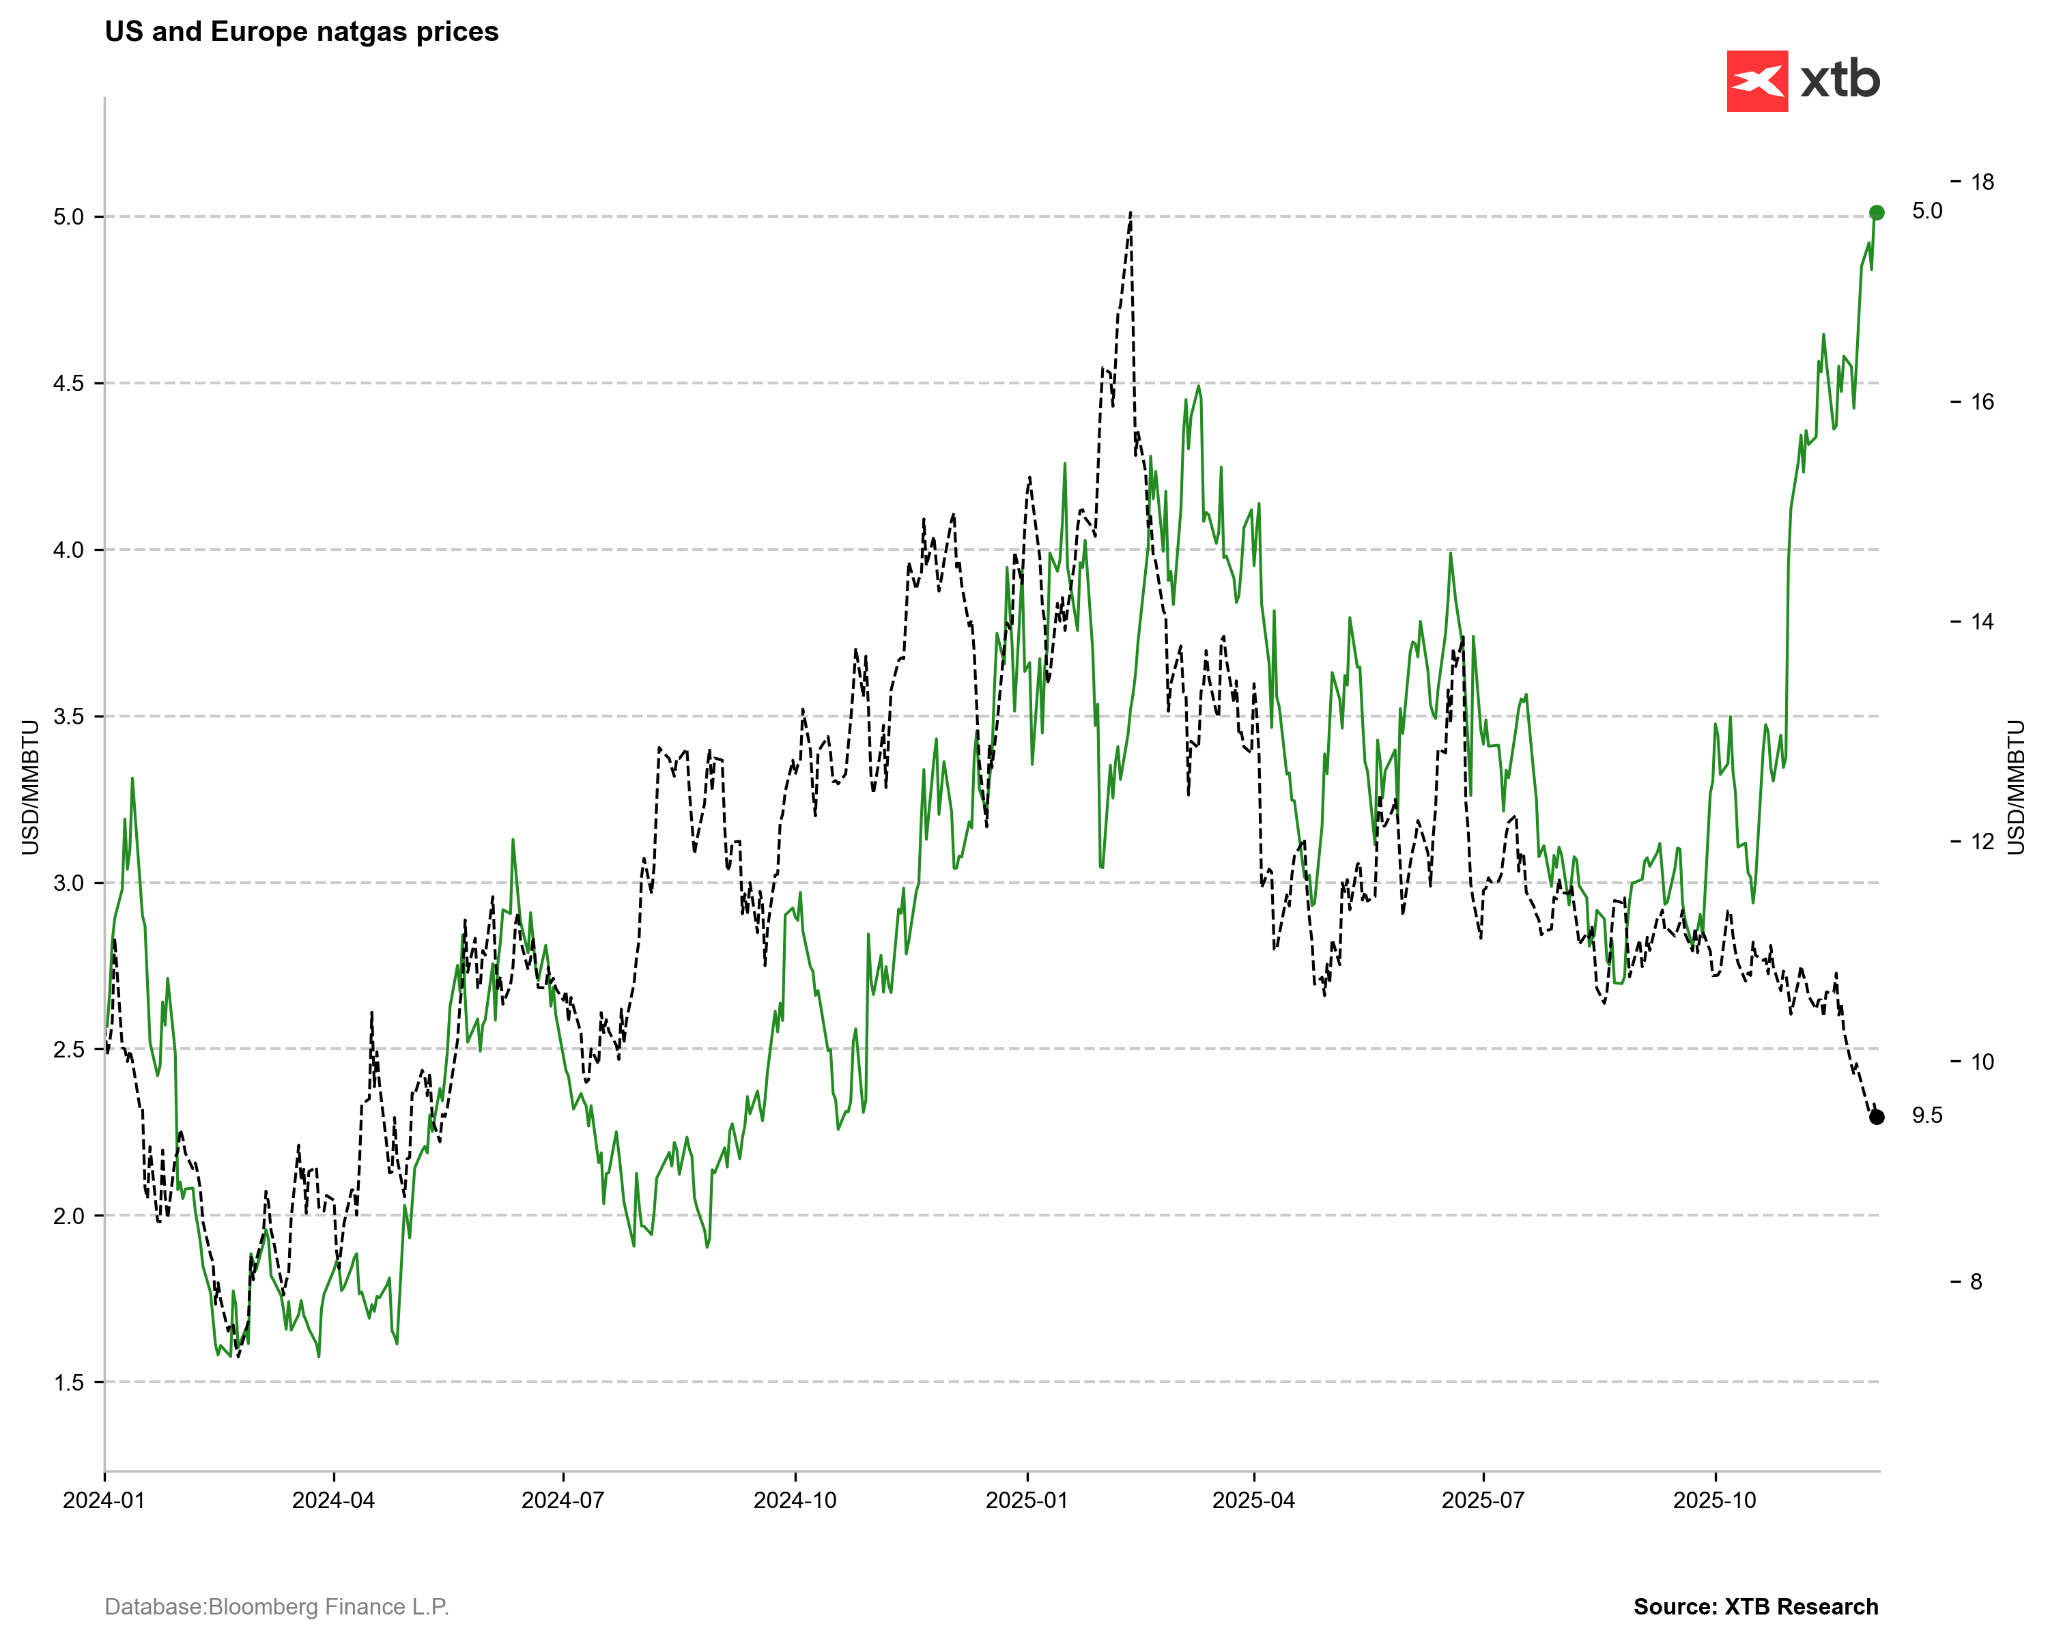 In the last two years, we have not seen such a large divergence in the behaviour of American and European gas prices. Europe is no longer fearing an energy crisis, and signals of weakening demand in Asia indicate a significant availability of LNG in case of increased need. Source: Bloomberg Finance LP, XTB
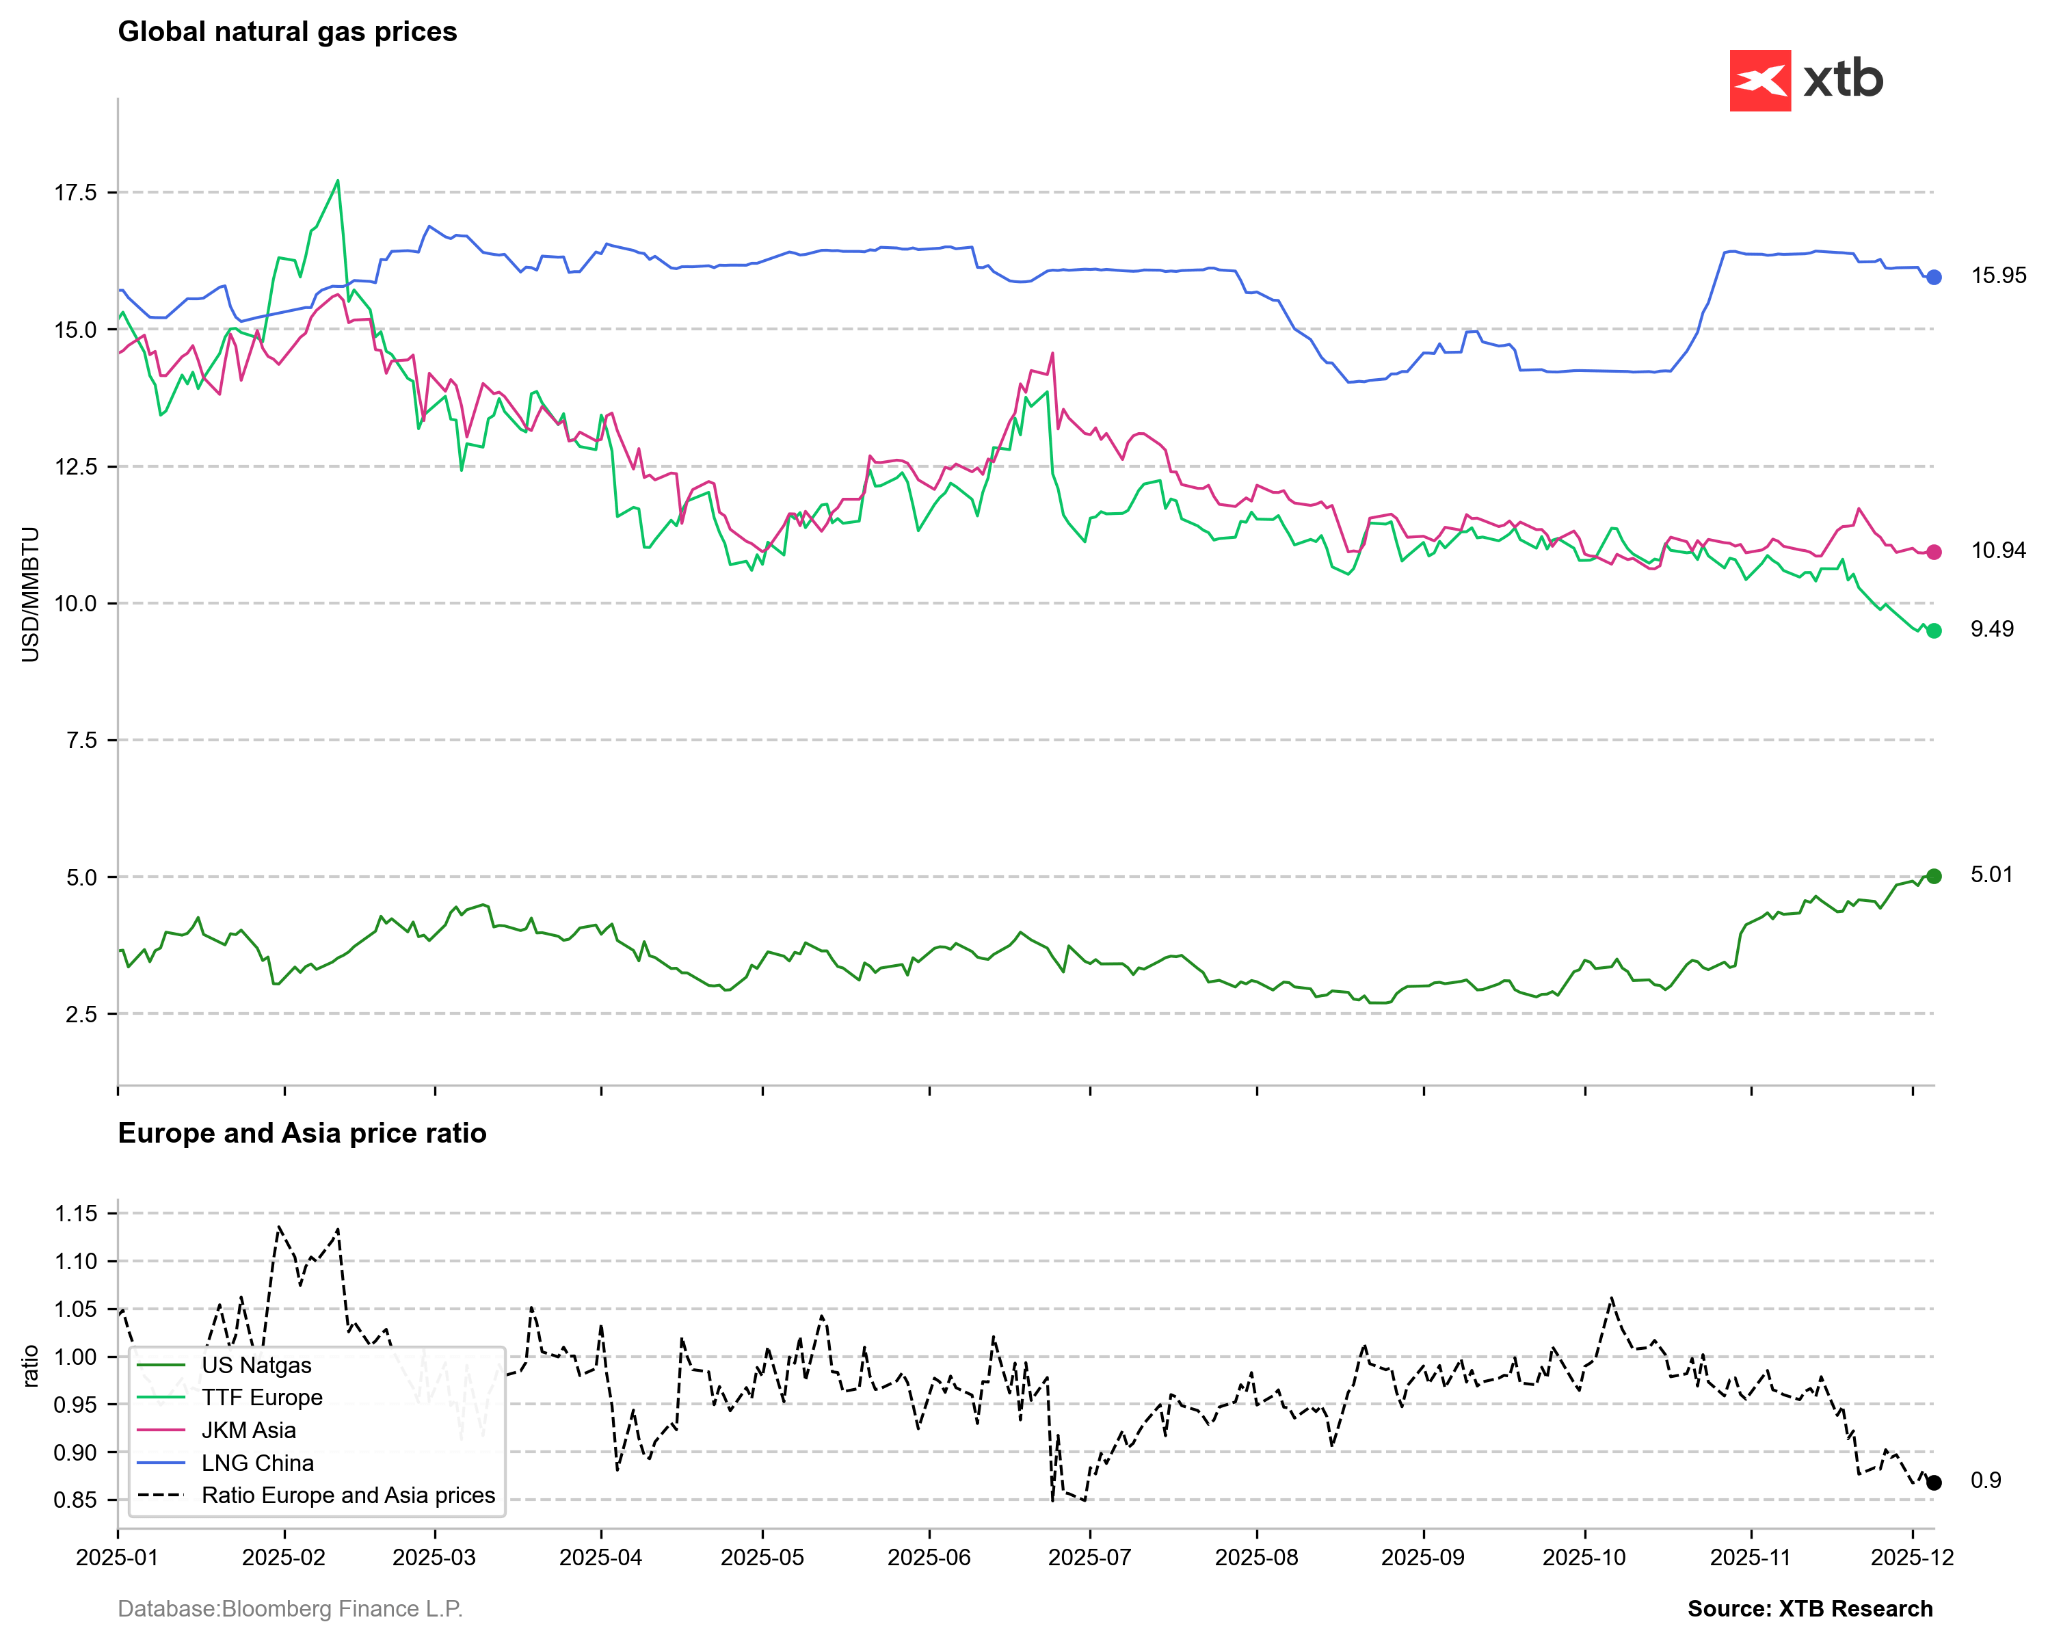 Prices in Europe have also decreased relative to prices in Asia (JKM). Prices are also falling in the Chinese market. Source: Bloomberg Finance LP, XTB
It is worth noting that the level of inventories in Europe is visibly lower than the 5-year average, although the recommended level of 80% storage capacity was exceeded before the start of the heating season. Source: Bloomberg Finance LP
Gas withdrawal from European storage facilities was quite high in the second half of November but has now returned to near the average, which could theoretically help prices stabilise at low levels. Low prices in Europe may also influence US prices in the longer term. Source: Bloomberg Finance LP
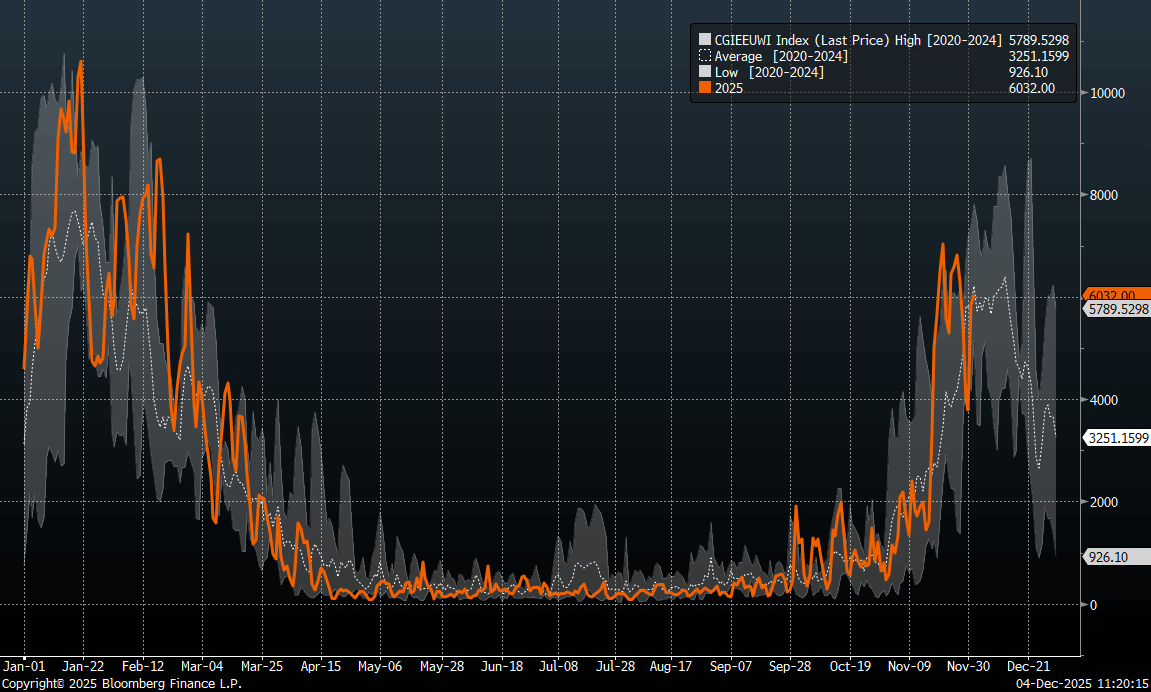
 The start of the inventory draw season began as expected and, importantly, is progressing slightly slower than the average. Nevertheless, if a change in the range of 100-200 bcfd materialises next week, inventory levels will sharply approach the average. Today, a minimal draw of 18 bcf is expected. Source: Bloomberg Finance LP, XTB
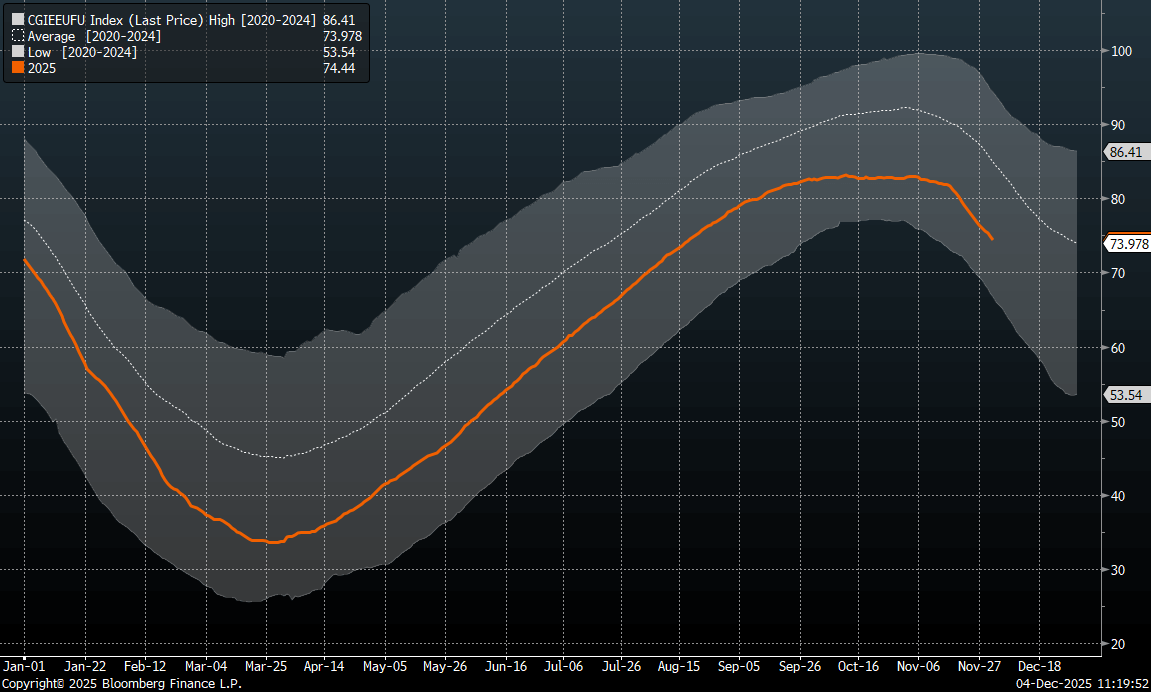
What Does Price Seasonality Suggest?
The price typically hit a local peak towards the end of November, followed by a correction. It is important to remember that November saw the last roll associated with contango, and the price is now in a several-month backwardation. The price may appear excessively high compared to historical standards, but as long as high gas consumption continues, the price may remain elevated. Should implied demand fall to the 120-140 bcfd range, this should signal a price reversal.
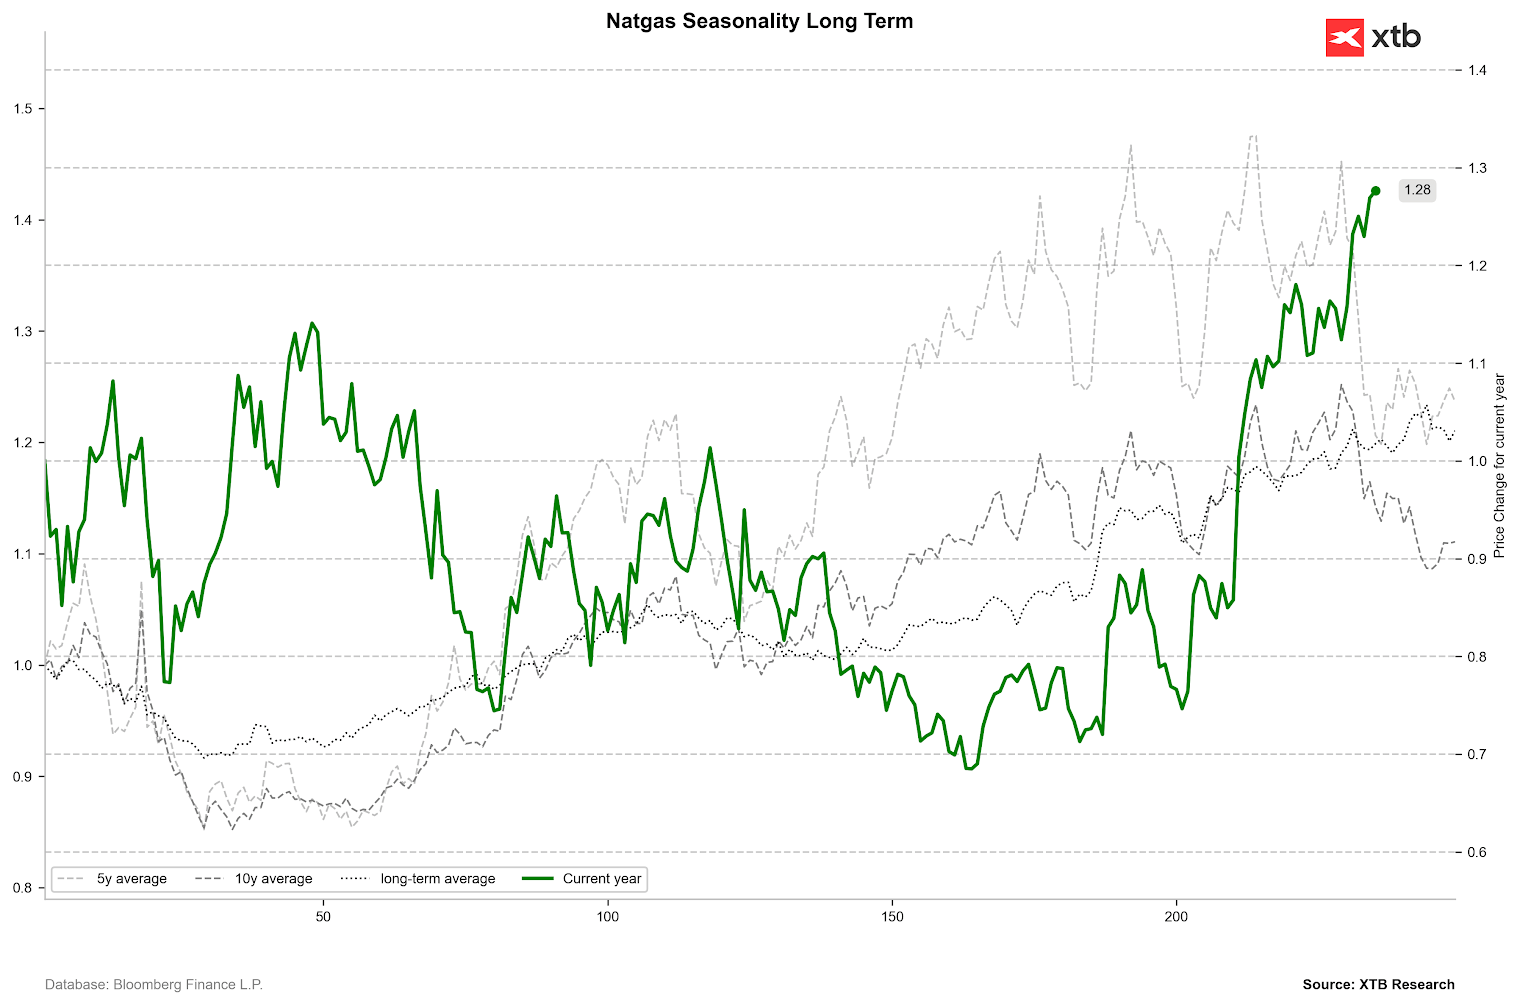 The price recorded a very strong increase over the last month and remains high relative to historical standards. Seasonality also points to declines in the coming weeks, although it should be remembered that this is partly due to the futures structure itself. Source: Bloomberg Finance LP, XTB
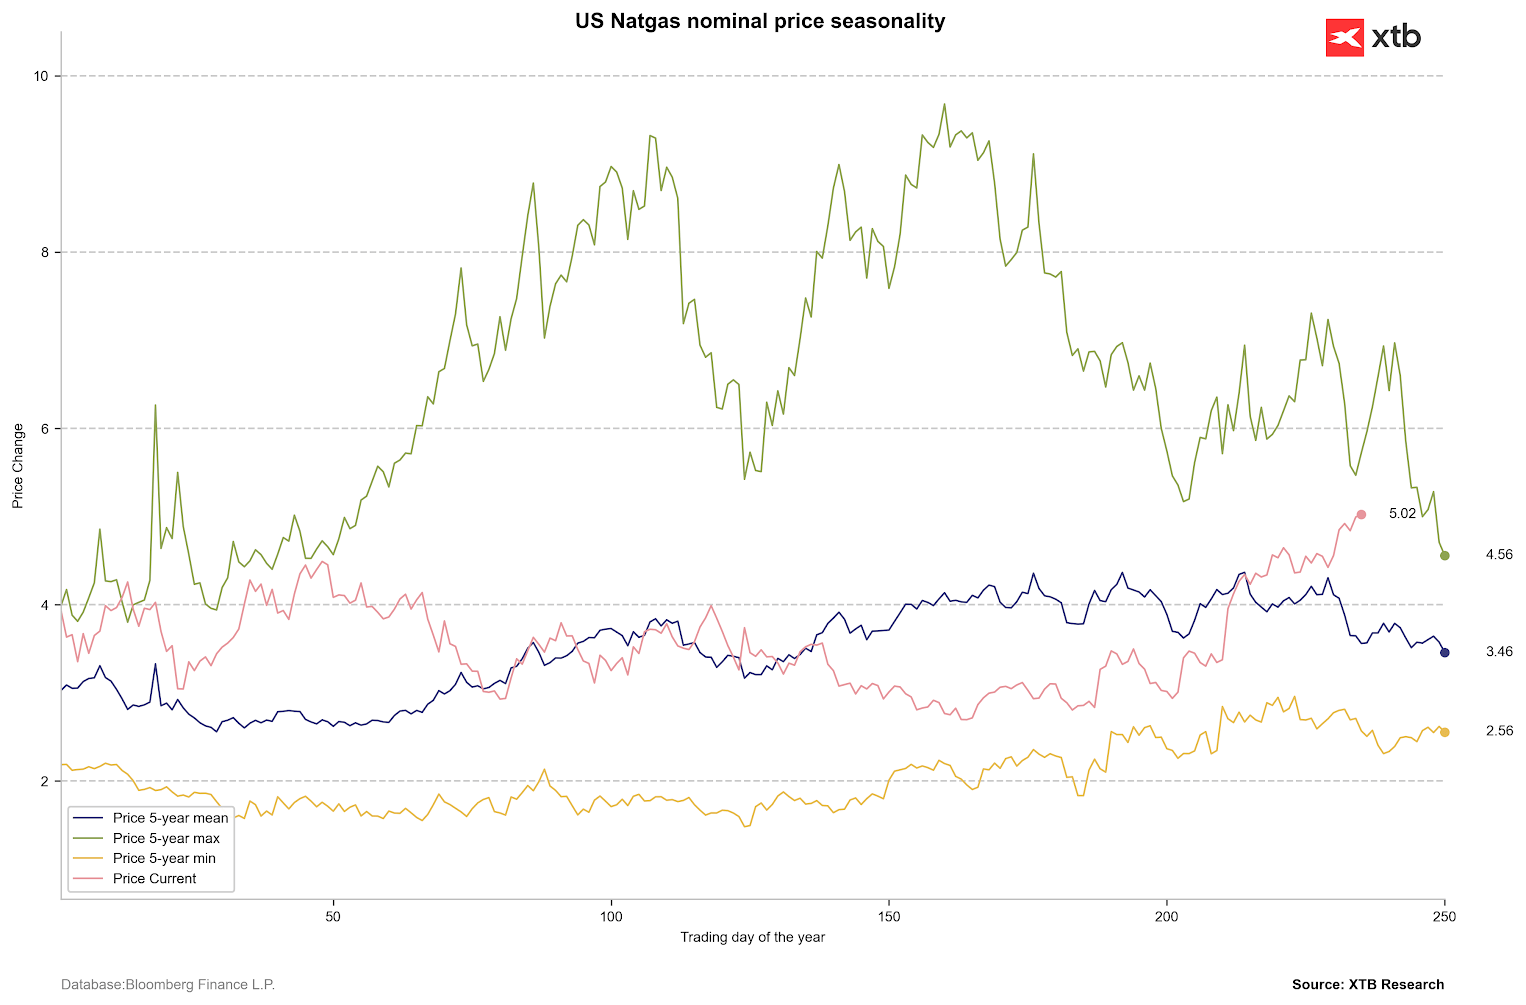 It is also worth noting that the nominal price is currently above the average.Source: Bloomberg Finance LP, XTB
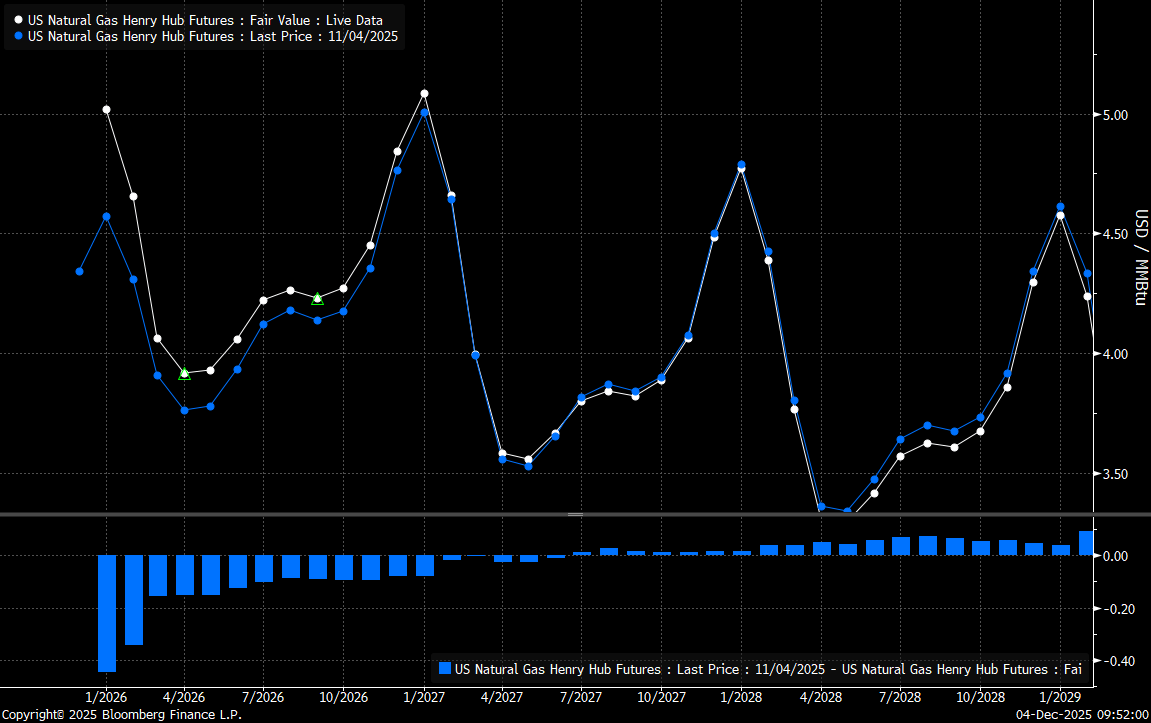
The current forward structure until April indicates strong backwardation, yet the elevated prices for the March, April, and May contracts suggest expectations of slightly higher-than-normal demand. We also see that the price change at the short end over the last month was extreme for the nearest two contracts, which may also indicate an overvaluation. However, whether we see a correction that brings the price closer to its averages will primarily depend on the weather. Source: Bloomberg Finance LP
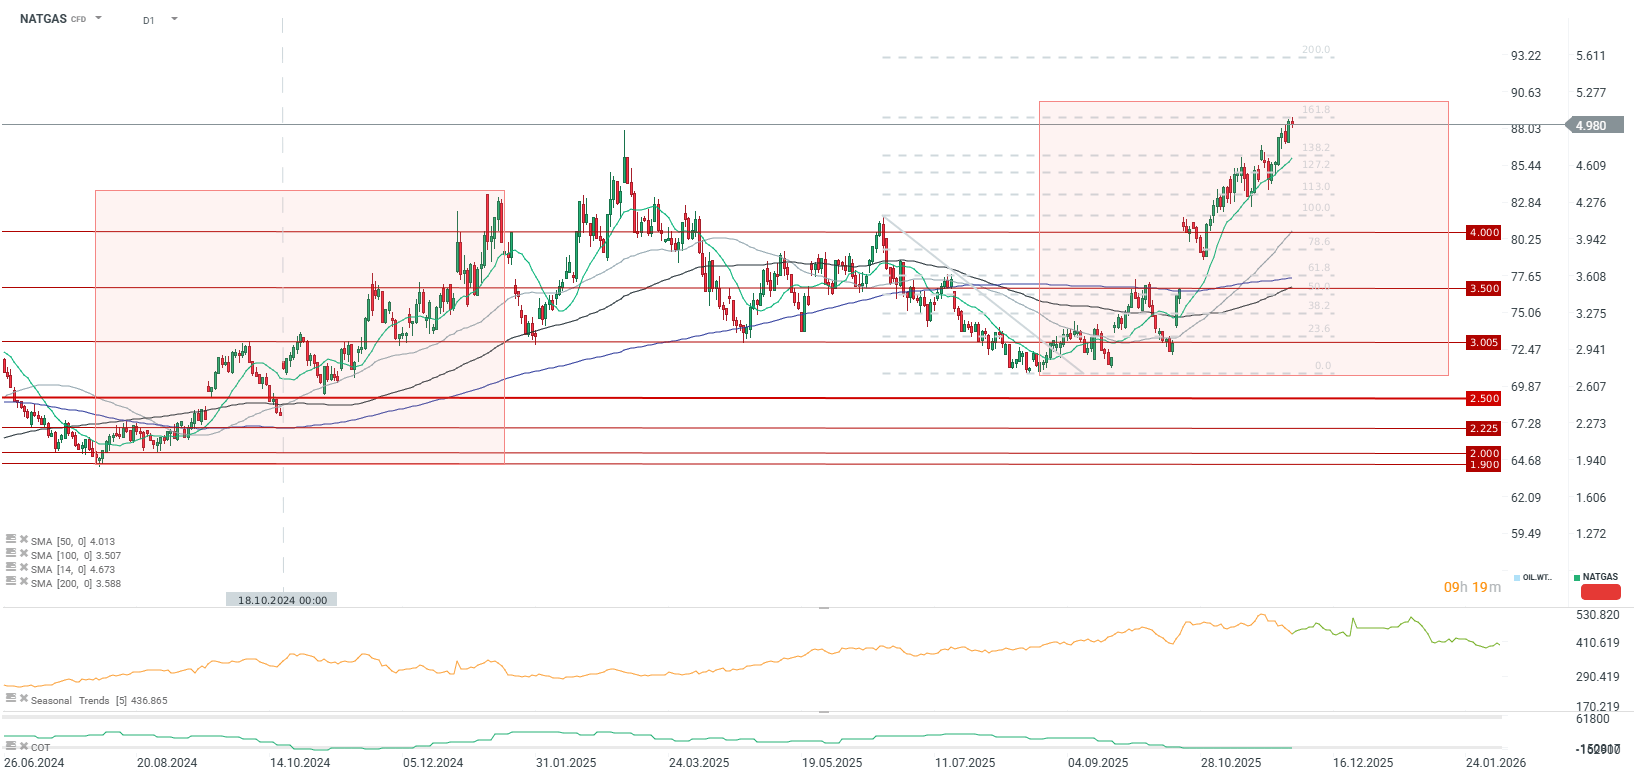
Technical Outlook
The price is currently reaching the $5/MMBTU level, which coincides with the 161.8% Fibonacci retracement of the last major downtrend wave. The price is supported by the 14-period moving average, which acts as a crucial short-term support. It is worth noting that the current pattern of increases looks very similar to last year's, although consumption is currently higher than in the same period a year ago. The scope of the increase suggests that a peak might be recorded in the second half of January. However, if gas consumption jumps even higher in January or February, the price could settle significantly higher than the current level and repeat the situation from 2022, albeit likely on a somewhat limited scale.

Morning Wrap: AI companies and gold back in favour? (22.07.2026)

Daily Summary: Semiconductors Rise in the Shadow of Geopolitical Turmoil

Tech sector catches its breath 🚀

Red Sea, but not the indices : The effects of the Bab al-Mandab blockade.