The precious metals market has seen an exceptionally sharp sell-off in recent days. Gold is down around 10% on a weekly basis, heading for its worst week since 1983, while silver fell more than 10% today before rebounding after “touching” a key support near its 200-day moving average.
- This sell-off is taking place amid elevated geopolitical uncertainty and rising stagflation risks, which would typically support demand for safe-haven assets—especially gold. Instead, precious metals are behaving more like momentum assets, declining alongside bonds and equity indices.
- This dynamic can be linked to shifting expectations around Federal Reserve policy. Rate cut expectations are being pushed out toward the autumn, benefiting both the U.S. dollar and Treasury yields. At the same time, surging oil prices reinforce the view that central banks, including the Fed, will remain cautious about easing monetary policy due to persistent inflation risks.
SILVER and GOLD charts (D1)
Silver halted its decline after reaching the EMA200 (red line), with today’s daily candle showing an increasingly long lower wick, suggesting demand at these levels. However, given its significant industrial use, silver may remain more sensitive to a potential oil-driven shock that could slow the global economy - and, by extension, industrial demand.
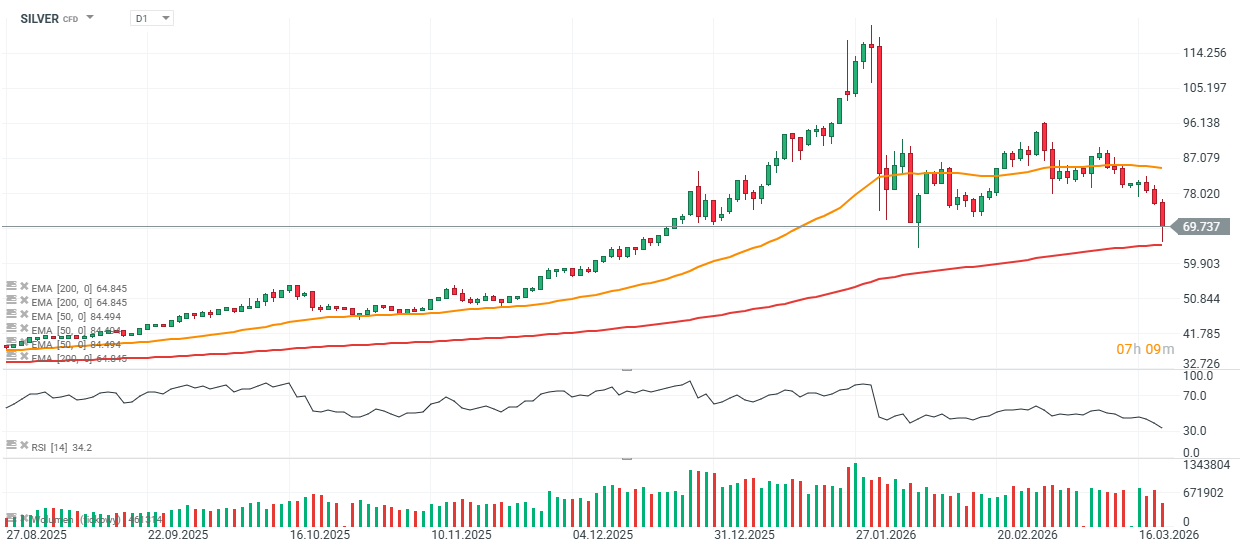
Source: xStation5
Looking at gold, the price has reacted at support from both the EMA200 (red line) and the previous sell-off zone from late January and early February (around $4,500 per ounce). A rebound from current levels could open the way toward a test of $5,000 per ounce, while a deeper correction could bring prices closer to $4,000, where strong price reactions were observed in autumn 2025.
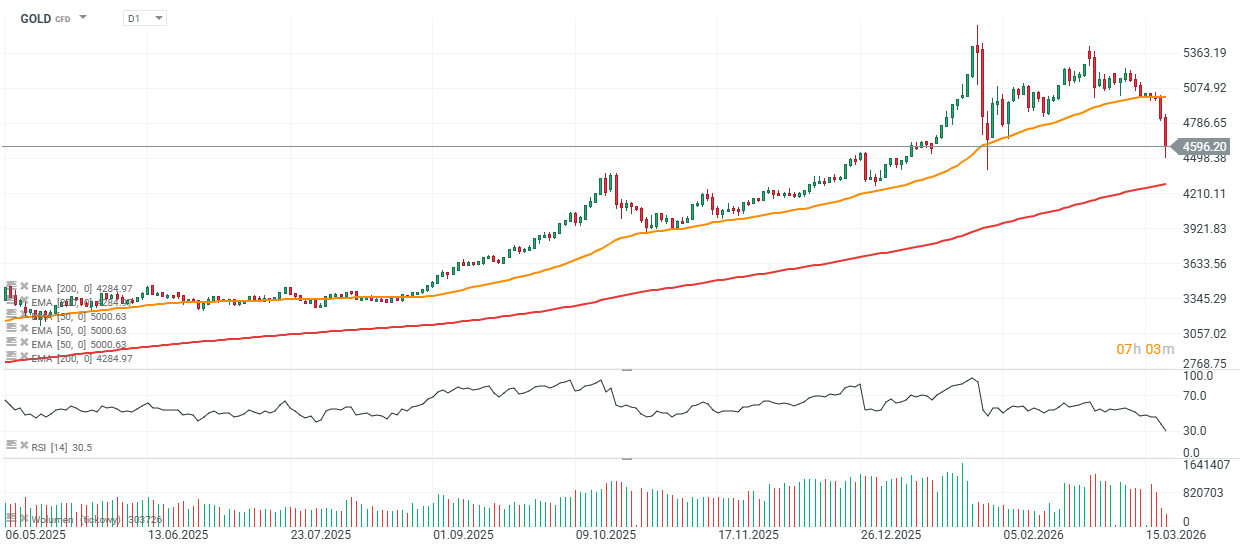
Source: xStation5

When will the rise in oil prices reach us?

Daily Summary: Equities Diverge as Tech Lags, Europe Rallies on Earnings & PMIs (24.07.2026)

Three markets to watch next week (24.07.2026)

Oil Slides Ahead of the Weekend!