


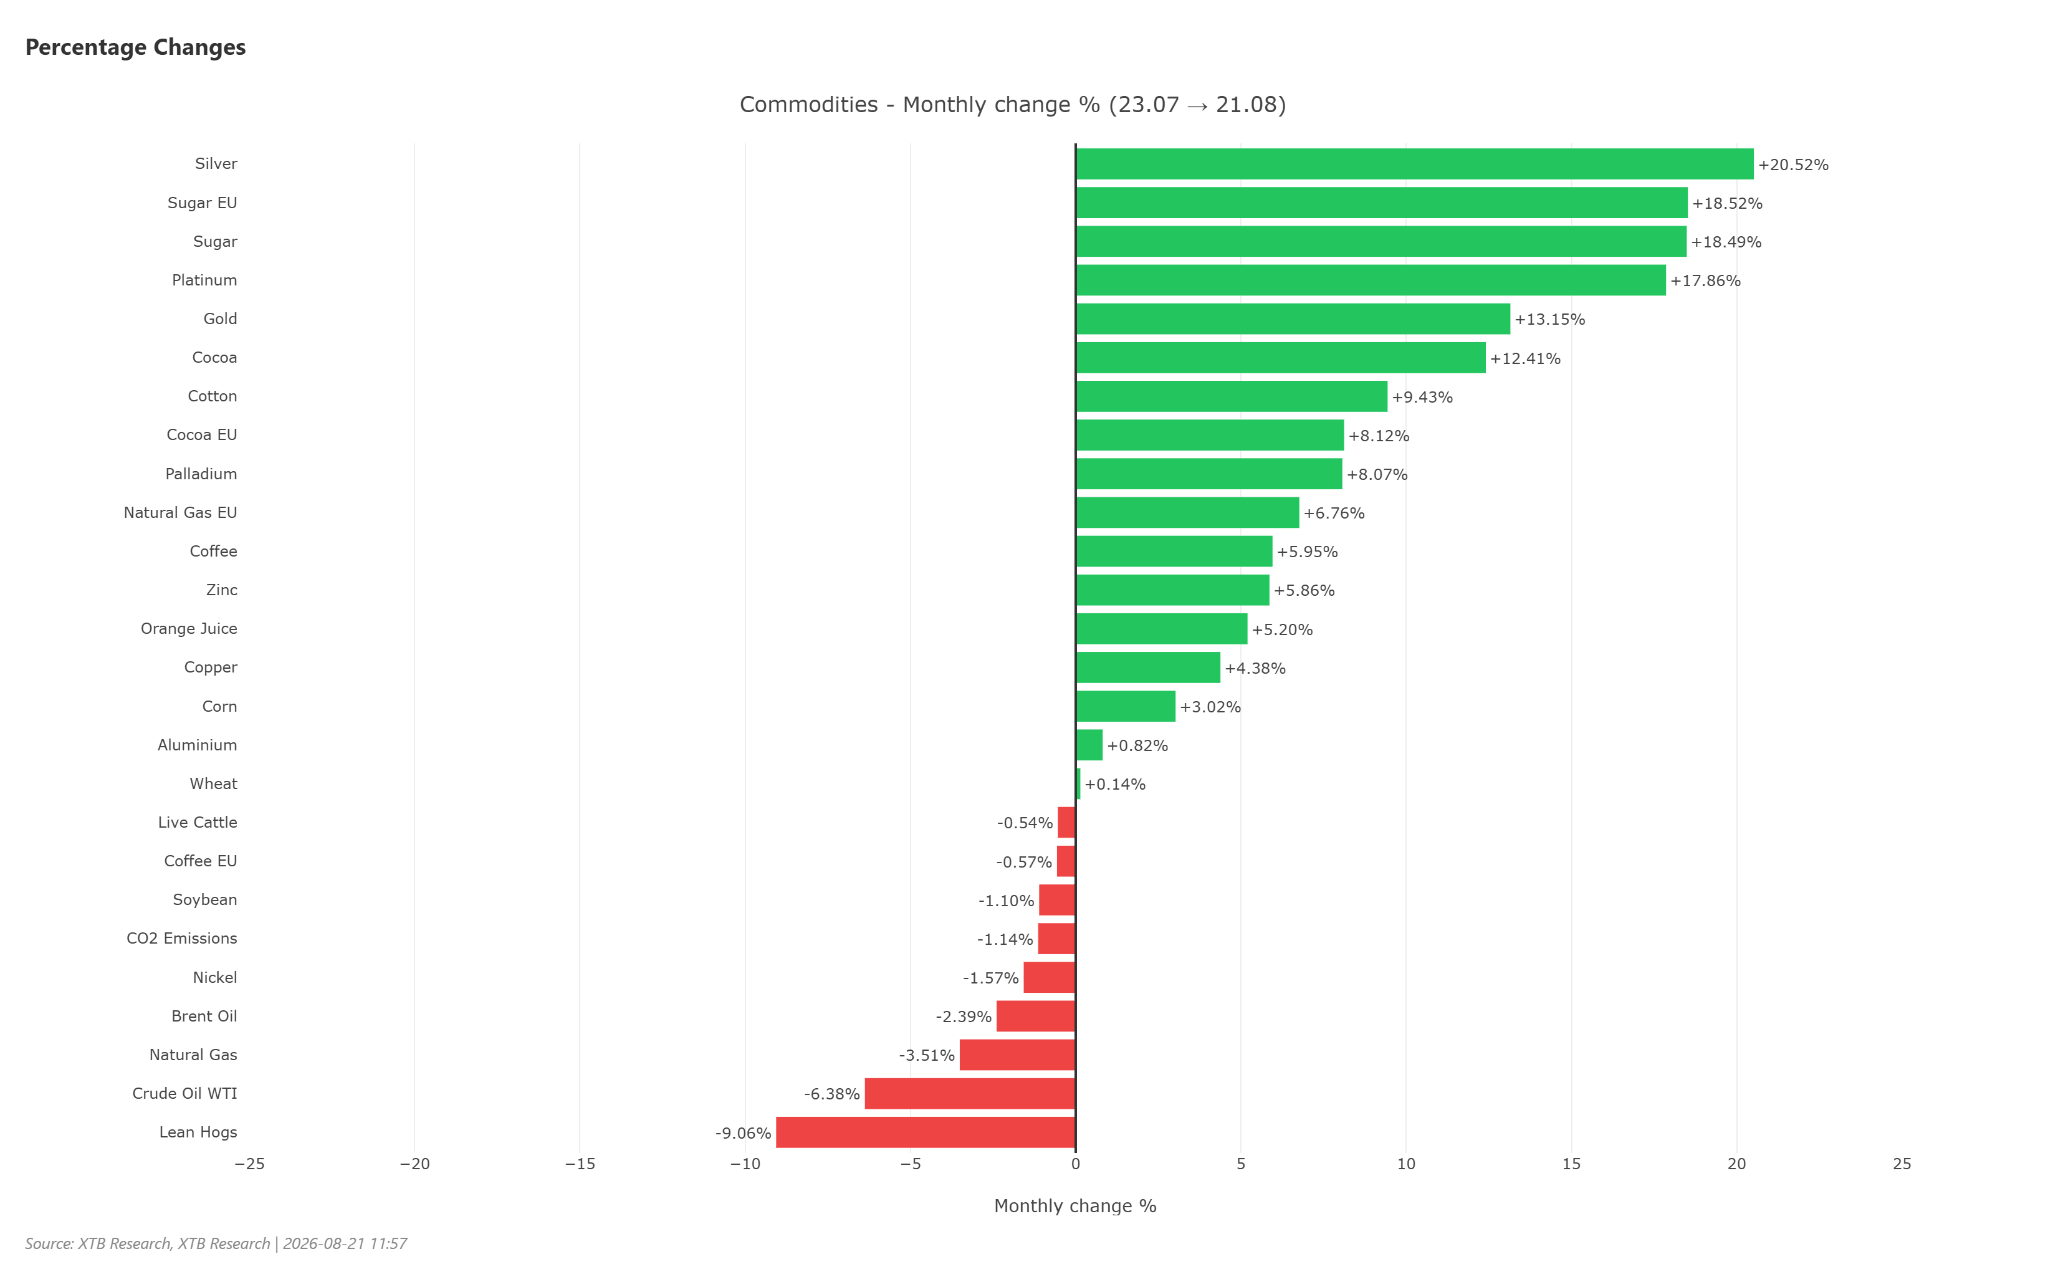
- Silver tests $70: The price has risen by over 20% in a month, breaking key technical resistances.
- Main causes: Increases are driven by a weak dollar, uncertainty in the debt market, and long-term inflationary pressure causing a rise in gold and, indirectly, silver prices.
- Forecast: Maintaining the $70 level opens the way to $72.50; key support is at $65.

- Silver tests $70: The price has risen by over 20% in a month, breaking key technical resistances.
- Main causes: Increases are driven by a weak dollar, uncertainty in the debt market, and long-term inflationary pressure causing a rise in gold and, indirectly, silver prices.
- Forecast: Maintaining the $70 level opens the way to $72.50; key support is at $65.
Sharp turmoil in the debt market, which affected the weakness of the US dollar, triggered a massive wave of demand for precious metals. Silver is dynamically breaking above the 100-period moving average and is showing up in the $69.40-$70.00 per ounce range, noting an impressive monthly increase of over +20.5%.
What is behind the rise in silver prices in the short and long term?
Debt market turmoil and weak dollar
Growing uncertainty surrounding treasury bond markets and the decline in the value of the USD are forcing capital to flee toward hard assets. We are observing a rebound in demand for silver from ETFs, although in the case of futures contracts, we do not see significant interest.
Inflationary pressure and expensive oil
Tensions in the Middle East and WTI crude heading towards $90/bbl are boosting global inflation expectations. While high energy prices in recent months acted rather negatively on bullion from a short-term inflation-spike perspective, it currently seems that inflation will stay with us for longer, which in the long run acts positively on gold, and with it, silver as well.
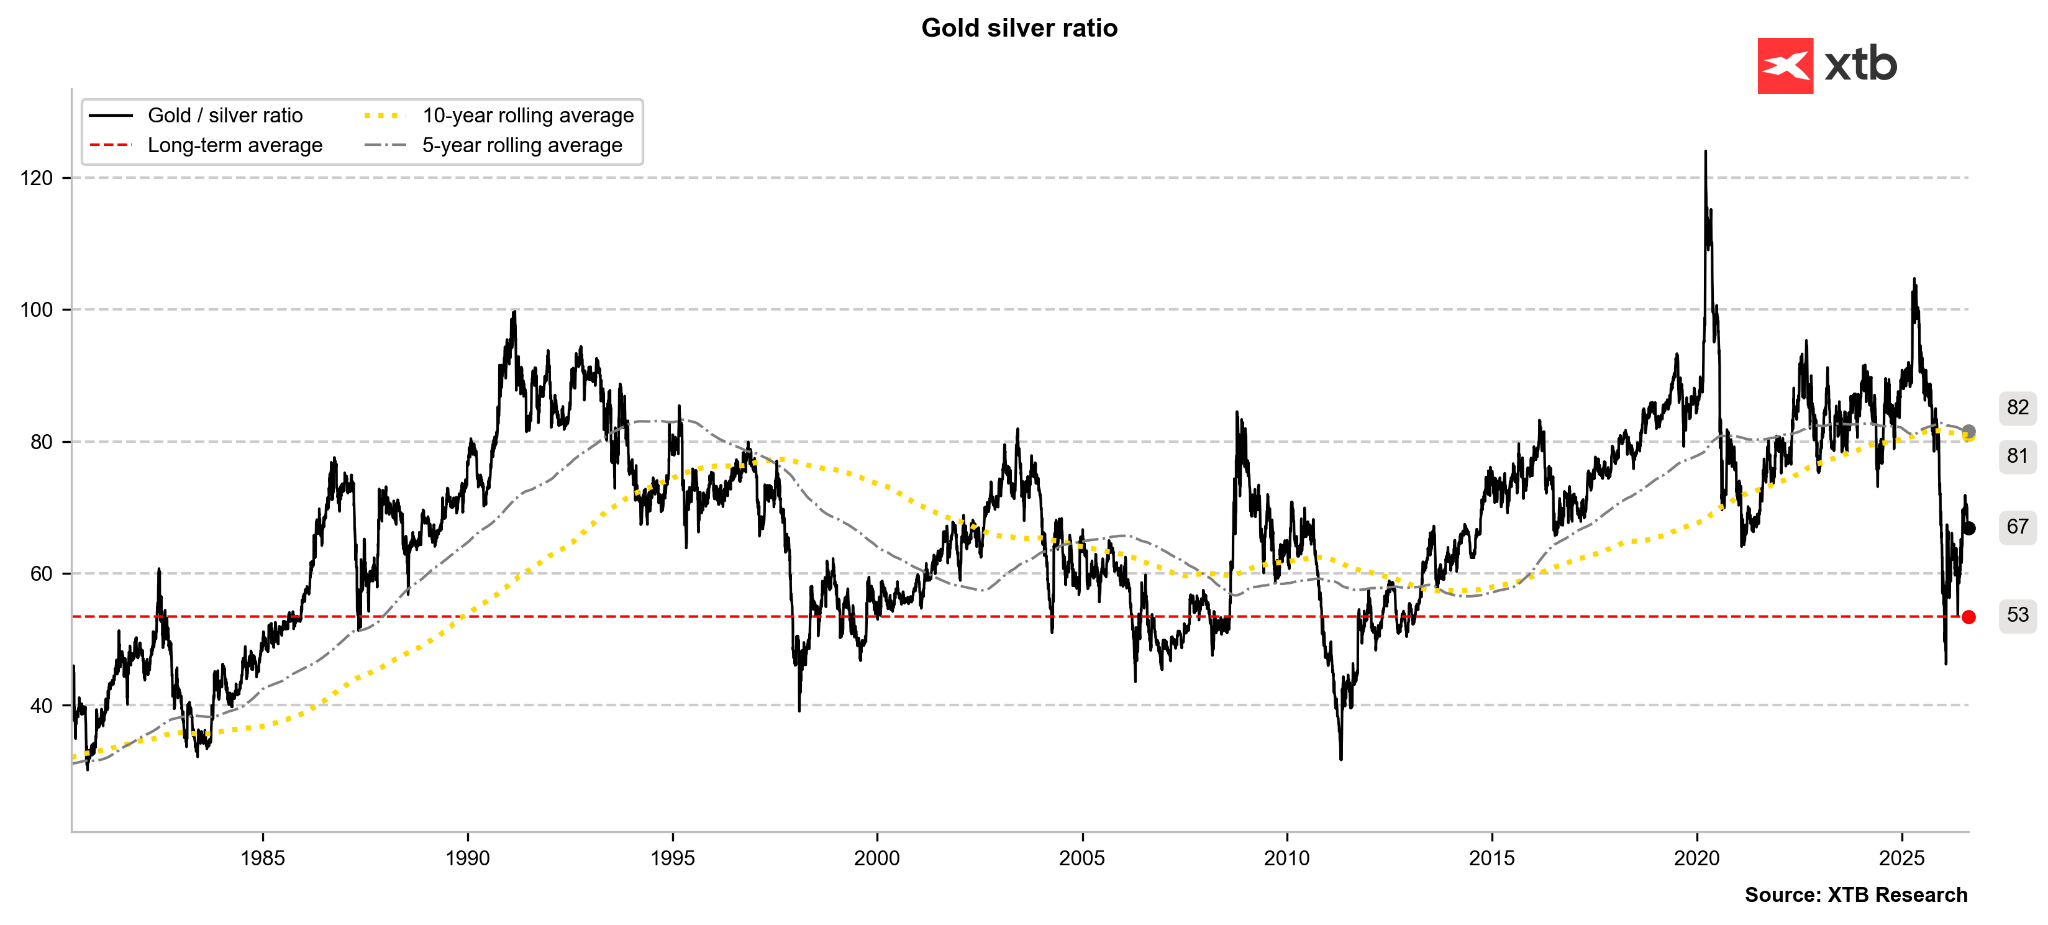 The gold-to-silver price ratio has started to fall again.
Source: Bloomberg Finance LP, XTB
Global copper supply issues
It is worth remembering that silver is usually mined as a byproduct of other metals, including primarily copper. When supply problems appear in the copper market, it also affects the silver market. Furthermore, in the event of a continued energy crisis, we may again see an increase in demand for alternative energy sources in which copper and silver are increasingly used.
What next? Key levels for silver
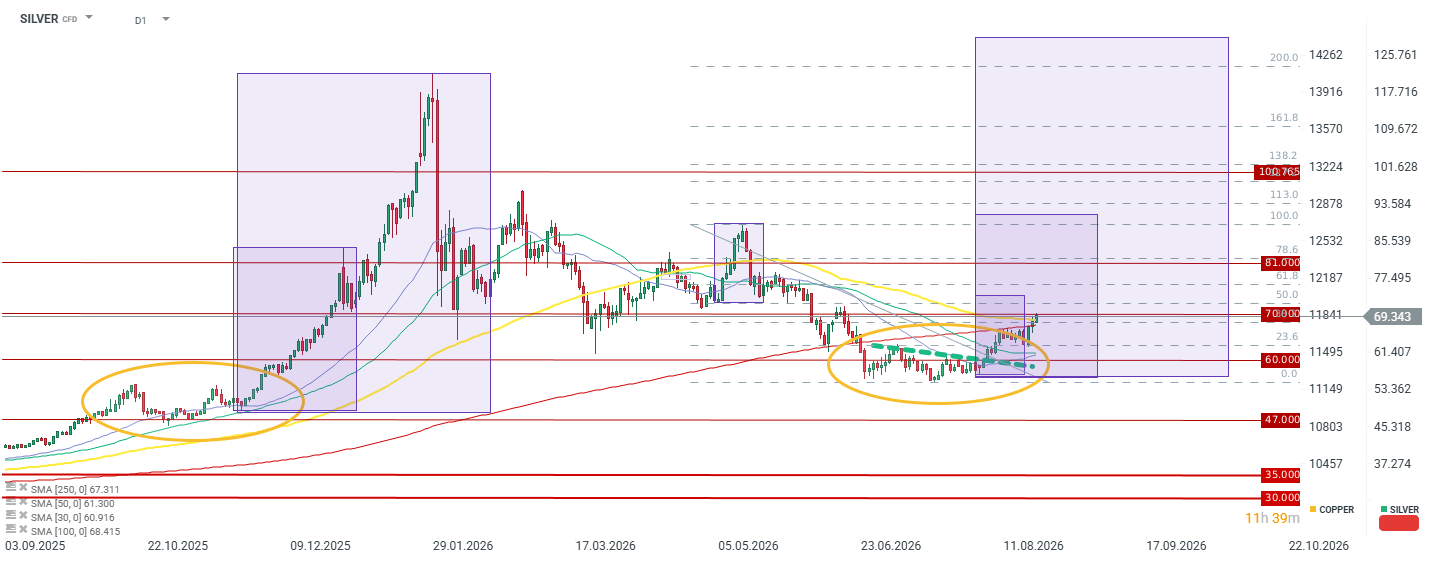
- Bullish scenario: A sustained move above $70.00 opens the way to resistance in the $72.50 area, where the 50.0 retracement of the last downward impulse is located. If this is a lasting recovery, an increase above the recent local peaks from May and breaking $90 per ounce will be possible. A return to a bull market in the silver market could even mean an attack on new historical highs in the long-term perspective. Assuming a similar situation to November 2025, the target could even be $130 per ounce.
- Correction scenario: High RSI and the Z-score valuation indicator (+3.21) call for caution. The first significant support is at the $65.00 level, and the key demand barrier runs at the 50-day average (approx. $61.30).
Source: xStation5
In the case of the silver market, the second half of the year usually brings higher volatility. A common turning point is around the September Fed meeting. If Walsh were to show an even more dovish side, which would be a move consistent with the Treasury Department's latest strategy (return to T-Bill buybacks), silver along with other precious metals could continue to rise.
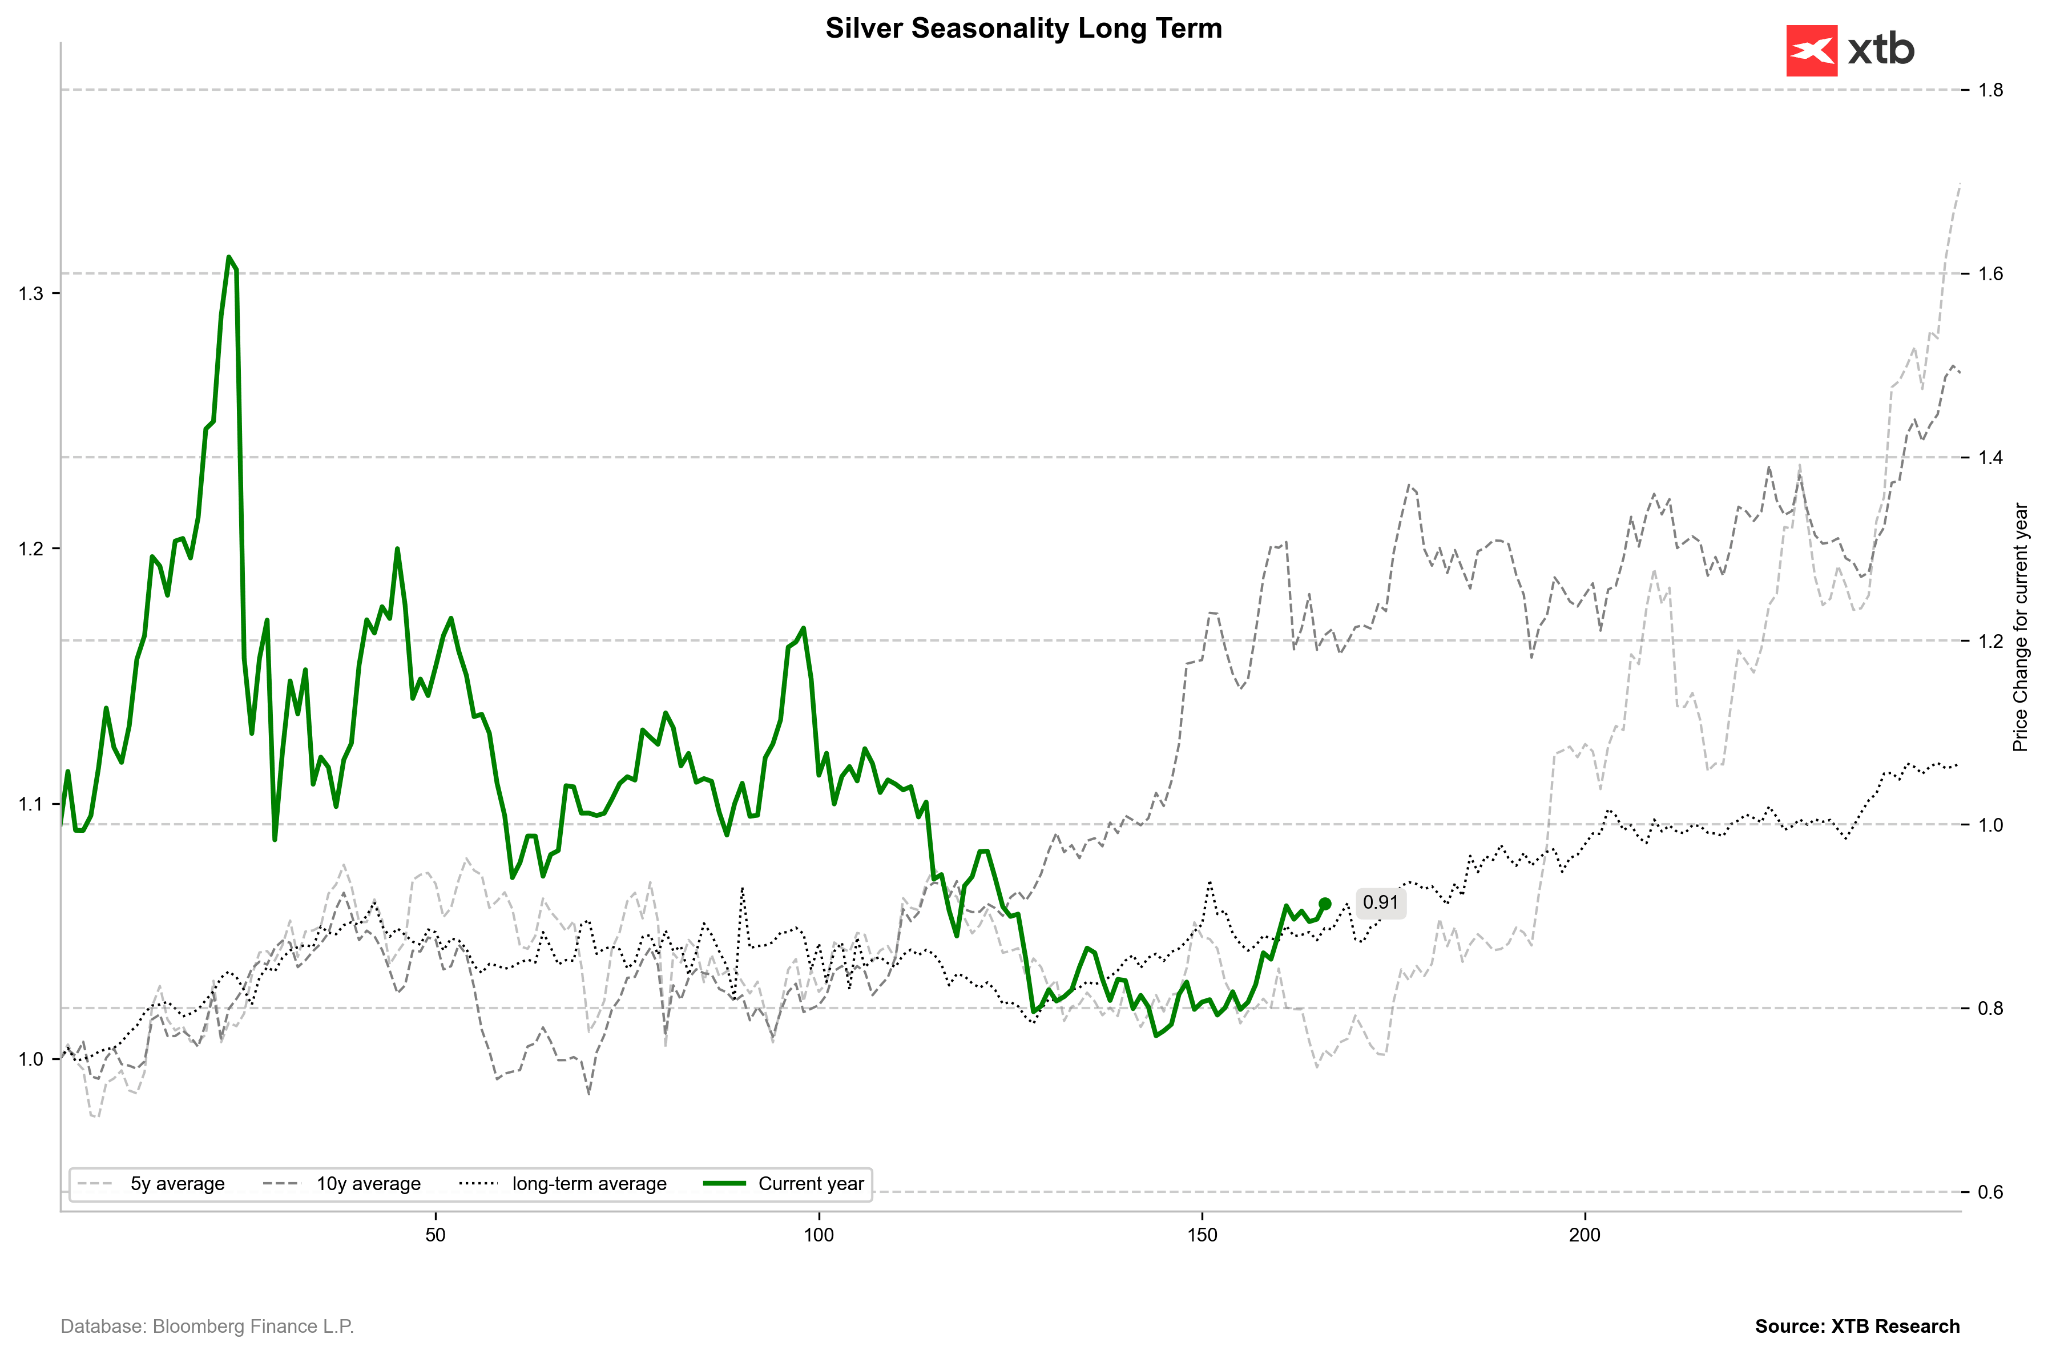 Seasonality in the silver market.
Source: Bloomberg Finance LP, XTB
Michal Stajniak, CFA
Deputy Director of the Research Department
XTB



Daily Summary: Oil at five-month highs, indices under pressure (23.10.2026)


BREAKING: France slows down, Germany holds on. Euro falls below 1.12



Daily Summary: Valuations Under Pressure, Capital Moves Away From Technology

Market Wrap: "Decent" results are not enough – tech stocks fall further; oil highest since May (22.10.2026)