
US indices are trading in a local sideways move today. Looking at US500 chart, one can see a head and shoulders formation which often heralds a trend reversal. The key support zone is marked with the green colour (2630 pts) - neckline of head and shoulders pattern as well as previous price reactions can be found there. Nevertheless, as long as the price sits above it, sentiment remains bullish. However, one should be aware that in case of a break below the aforementioned support, downward move may accelerate.
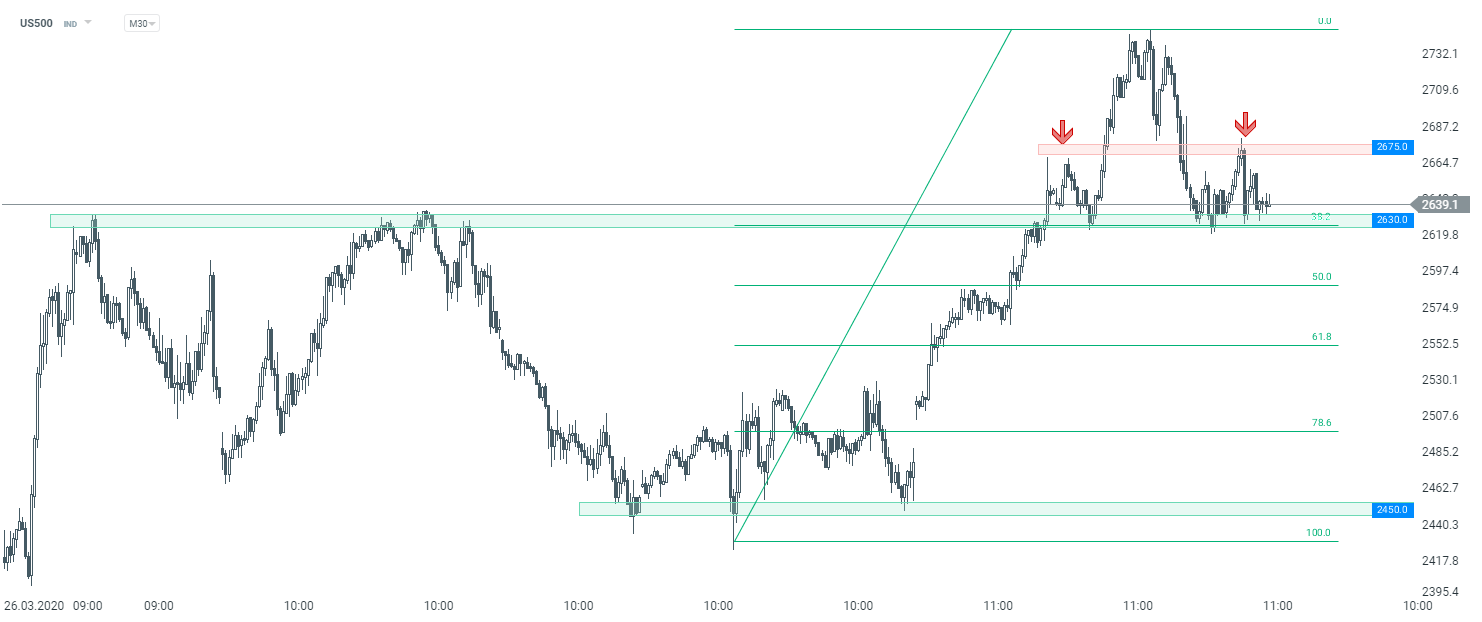 US500 M30 interval. Source: xStation5

Daily Summary: Wall Street Regains Ground; Another Intervention in the Yen Market❓

Three Markets to Watch Next Week (July 31, 2026)

Market Wrap: European equities at 3-week highs! Apple dips in US premarket!

Economic Calendar: Key European CPI Readings and Oil Giants’ Earnings