
US500 is currently reacting to resistance level that results from 1:1 market geometry (3,160 pts). An upward move which was started at 7:30 am BST looks exactly the same as the one that started after 04:30 pm BST during yesterday’s trading. Should the current M30 candle close at current levels or below, today’s gains may be erased even further. Meanwhile CNBC reported that the index has formed its first ‘golden cross’ since April 2019 which in theory should be regarded as a bullish chart pattern.
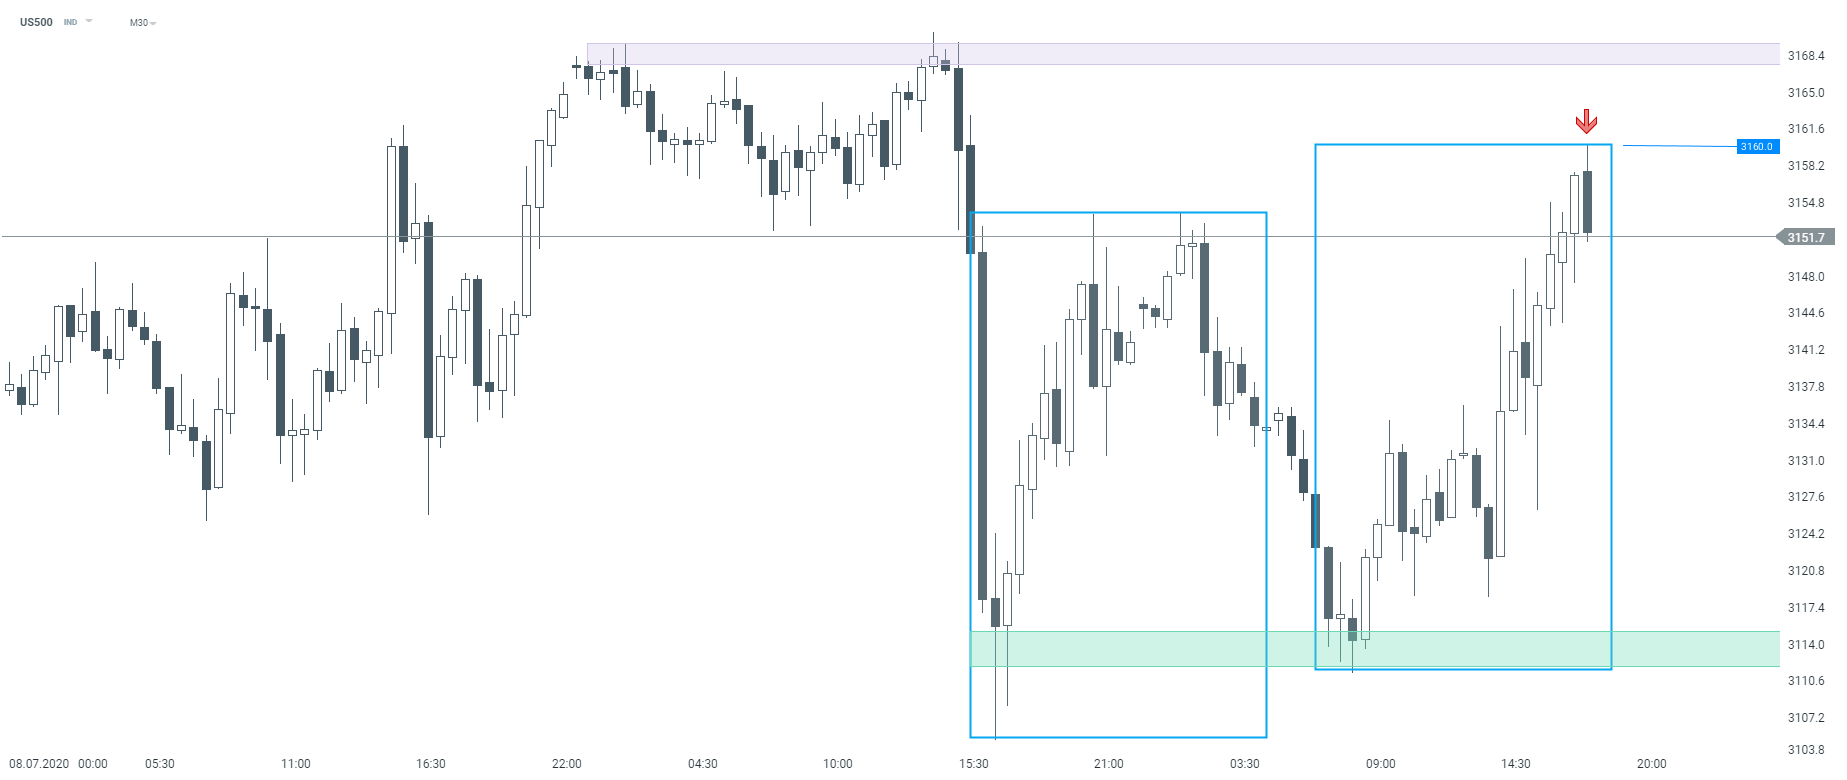 US500 M30 interval. Source: xStation5

Daily Summary: Wall Street Gains, Dow Jones Near All-Time Highs After Softer PPI Data
US Earnings Season: What Does Wall Street Expect from S&P 500 Companies?

US Open: S&P 500 Gains on Softer PPI Inflation 🔼 Memory Stocks Slip, PayPal Surges 15%
Market Wrap: Indices gain on technology stocks rise and lower US PPI data