
USDCAD pair has been in a downtrend since March 2020. Looking at D1 interval, one can see that from the very beginning of the downward impulse, 5 corrections of the same size (red rectangles) appeared on the chart, which, in accordance with the Overbalance methodology, proves that the downward trend has been maintained. Last week we could observe lower volatility and local consolidation, however price continues to decline after the weekend. Therefore it is possible that the pair will test January lows at 1.2600 in the near future. The zone around 1.30 remains the key resistance in the medium term.
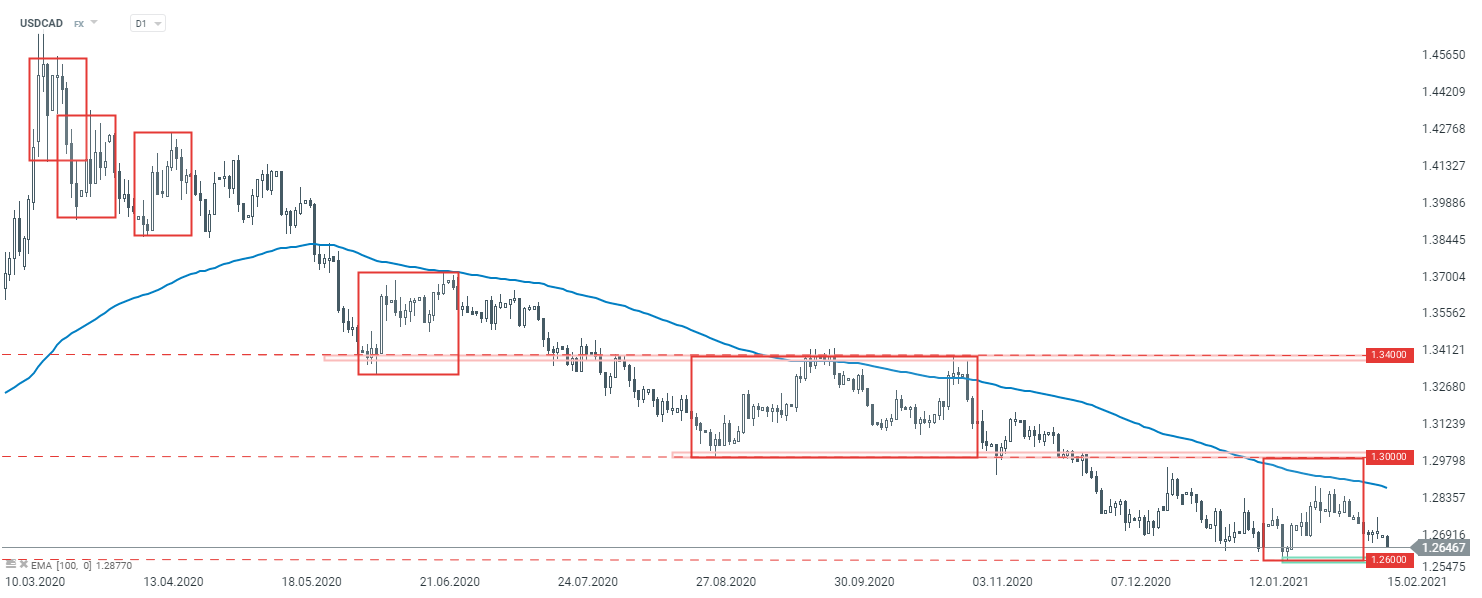
USDCAD interval D1. Source: xStation5
Looking at the lower timeframe - H1, declines continue today after better than expected manufacturing sales data from Canada. Pair broke below last week's lows and continues moving down. If the current sentiment prevails, one could expect a move towards this year's lows at 1.2600. If this support level is cleared, the sell-off may reach 127.2% external Fibonacci retracement. On the other hand, breaking above the resistance at 1.2670 and preferably above the downward trendline, may pave the way for a bigger upward correction.
 USDCAD interval H1. Source: xStation5

Daily Summary: Equities Diverge as Tech Lags, Europe Rallies on Earnings & PMIs (24.07.2026)

Three markets to watch next week (24.07.2026)

BREAKING: Eurozone recovery? Positive PMI data tempered by high oil and gas prices

Economic Calendar: Industry’s condition in the shadow of oil prices