
US CPI data released yesterday showed yet another acceleration in price growth and has once again put into question the Fed's narrative of transitory inflation. Data release triggered significant moves on USD and equity markets. Elsewhere, oil experienced wild swings today on the back of rumors that OPEC+ members have reached an agreement on output. Let's take a look at technical situation on EURUSD, OIL.WTI and US100.
EURUSD
Let’s start today’s analysis with the major currency - EURUSD, which has been trading in a downward trend recently. Following yesterday’s US inflation data, the pair painted a new local low, confirming bearish sentiment. Should market bears manage to remain in control, continuation of the downward move towards the support at 1.1705 (March low) may be on the cards. On the other hand, if buyers manage to regain control, the nearest key resistance to watch lies at 1.1890 and is marked with the upper limit of 1:1 structure, as well as previous price reactions and 23.6% Fibonacci retracement are located.
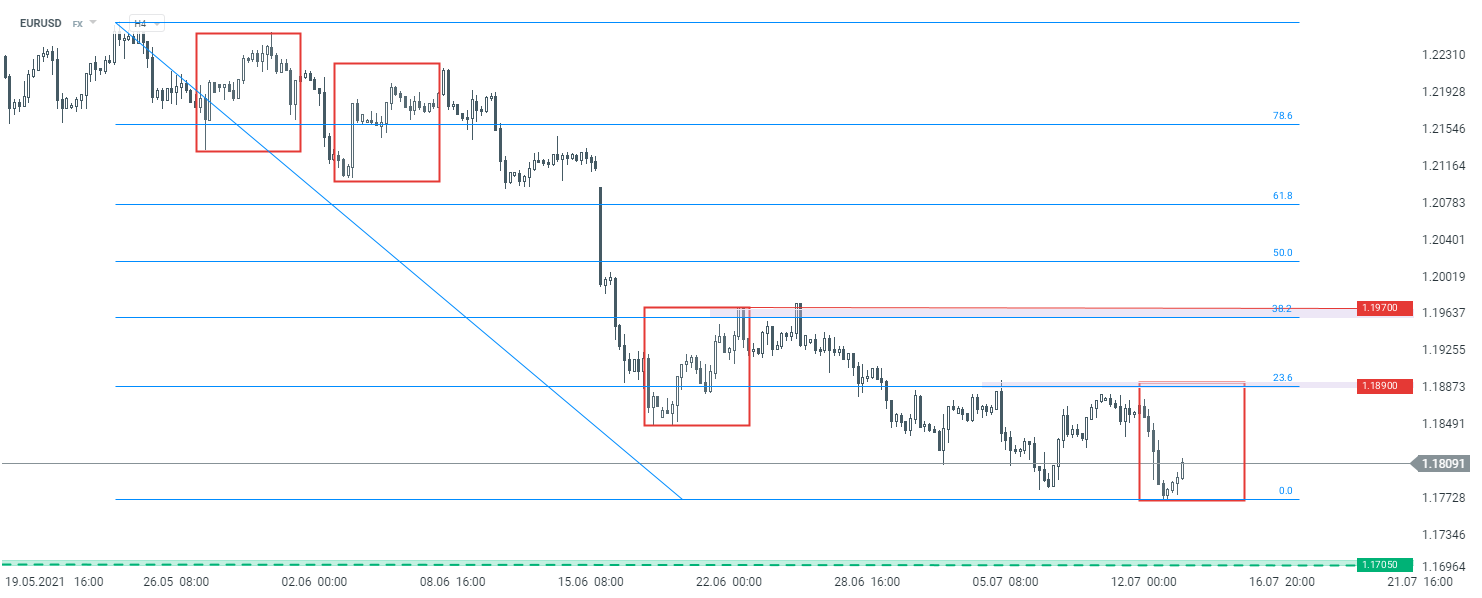 EURUSD H4 interval. Source: xStation5
OIL.WTI
Next, let's take a look at the oil market. Analysing the chart on the H4 interval, one can see that the recent downward correction was halted at the key support area. The zone marked with green colour on the chart below is a result of lower limit of 1:1 structure, 38,2% Fibonacci retracement as well as lower limit of upward channel. According to the classic technical analysis, bouncing of this support confirms mid-term bullish sentiment and the continuation of an upward trend seems to be the base case scenario. The nearest resistance to watch lies at $69.60
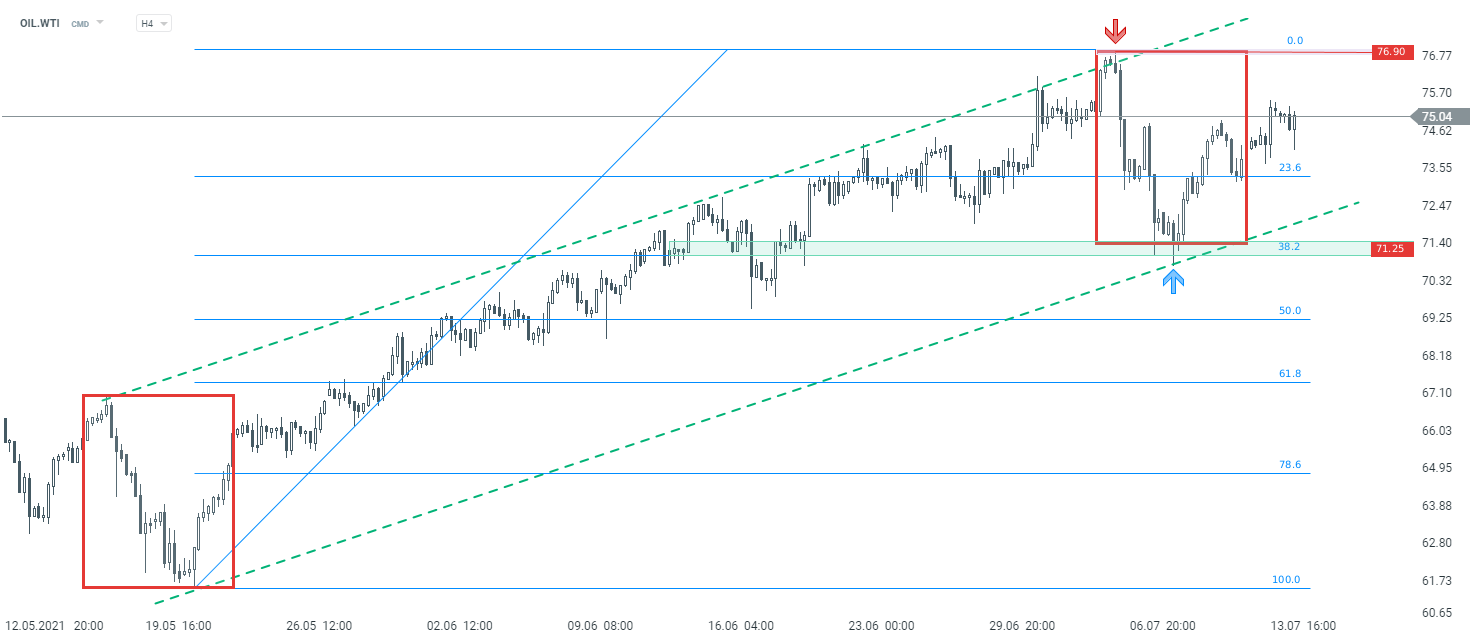 OIL.WTI H4 interval. Source: xStation5
US100
Last but not least, let's take a look at the US tech index - Nasdaq (US100). Looking at the H4 interval, one can see that the index has once again reached a fresh all time high this week. It should be noted that the trend is very strong, so trying to time the top may be a risky play. On the other hand, a downward correction may occur at any time. Considering such a scenario, the nearest key support to watch lies at 14,685 pts handle, where the lower limit of 1:1 structure is located. This level is also strengthened by the 65-period moving average which has acted as a support recently. On the other hand, breaking below the aforementioned support may trigger a bigger downward move.
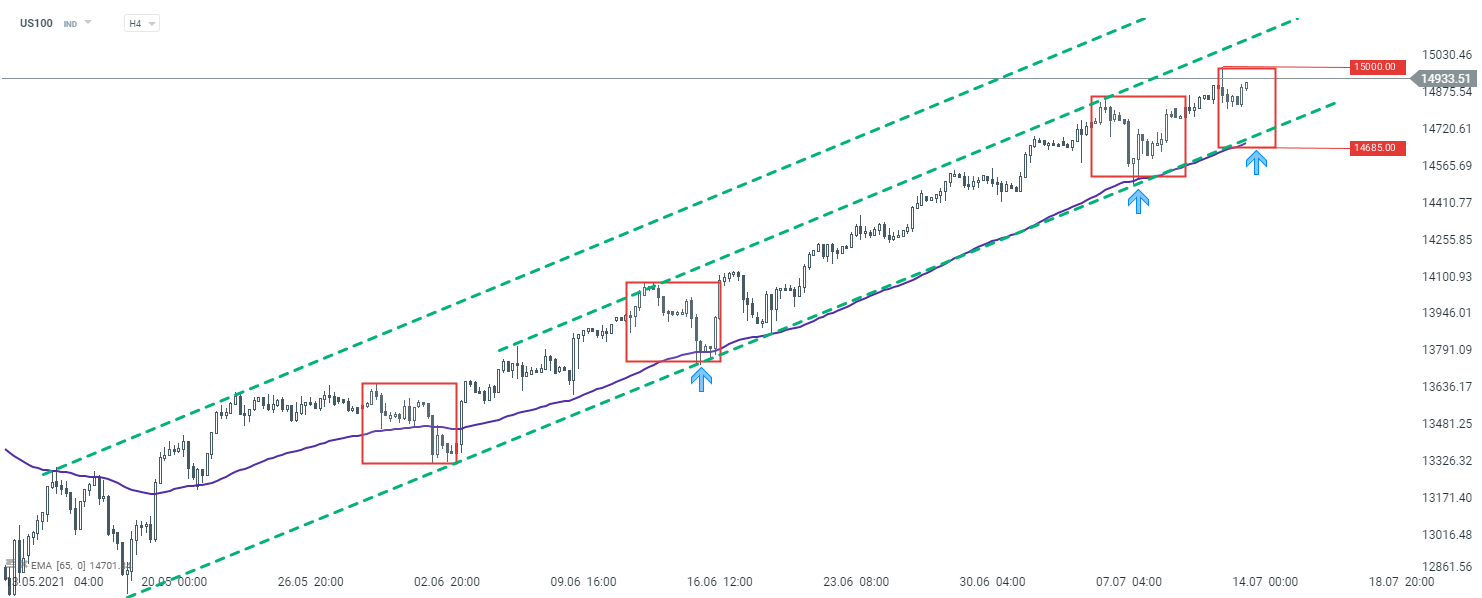 US100 H4 interval. Source: xStation5

When will the rise in oil prices reach us?

Daily Summary: Equities Diverge as Tech Lags, Europe Rallies on Earnings & PMIs (24.07.2026)

Three markets to watch next week (24.07.2026)

Oil Slides Ahead of the Weekend!