
GOLD
Let’s start today’s analysis with the gold market after precious metal failed to break above the $1,810 handle last week. This resistance area was a result of 78.6% Fibonacci retracement of the downward impulse started at the beginning of September as well as previous price reactions. Gold has pulled back from this zone twice, which may herald a deepening of a downward correction. Should the price stay below the local resistance at $1,798, the next potential target for sellers could be $1,773.7 support, where a lower limit of 1:1 structure as well as lower limit of upward channel can be found. On the other hand, according to the Overbalance methodology, bouncing off this support ($1,774.7) may herald a resumption of the upward move.
 GOLD H4 interval. Source: xStation5
US100
Next, let’s move to the US tech index chart - Nasdaq (US100). Looking at the D1 interval, one can see that buyers manage to erase the whole downward correction that started in early September. However, shortly after reaching the 15,700 pts resistance near record highs, sellers arrived and the shooting star formation was painted on the chart. This candlestick pattern usually heralds a trend reversal, so buyers should stay on guard. Considering the bearish scenario, the nearest key support - in the 15,280 pts area - could be at risk. The area marked with green colour on the chart below is a result of previous price reactions, as well as local 1:1 structure. If buyers manage to hold the price above the 15,280 pts support, another attack on 15,700 pts may be launched. On the other hand, should sellers manage to break below 15,280 pts area, a bigger sell-off may occur.
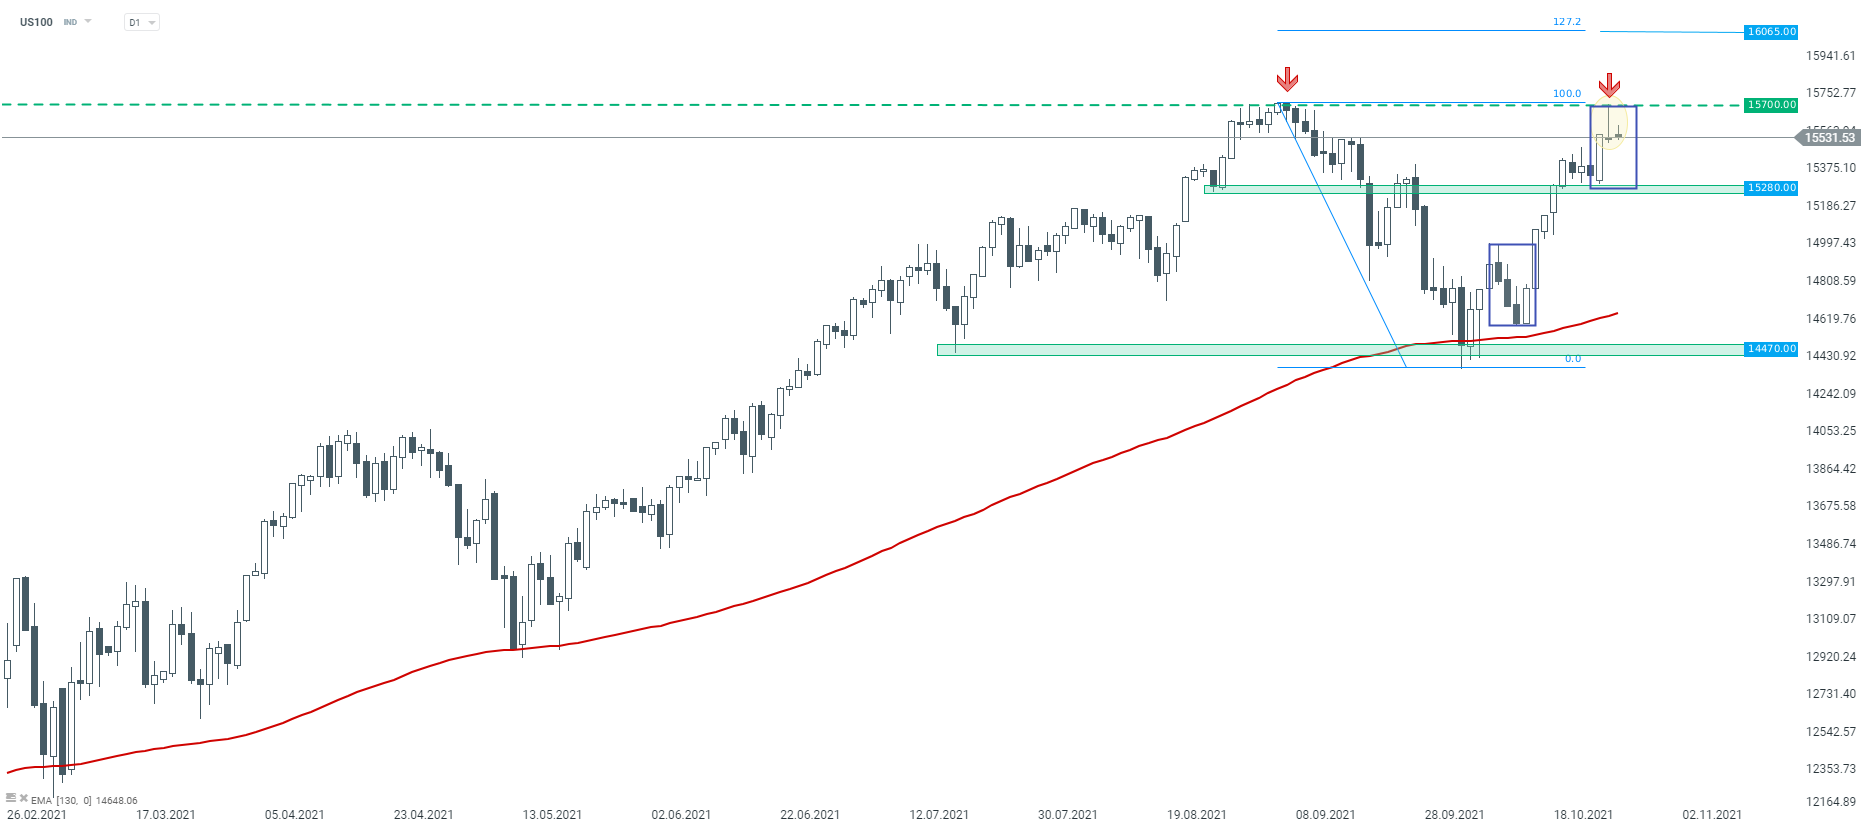 US100 D1 interval. Source: xStation5
DE30
Last but not least, let’s take a look at the German index - DAX (DE30). Looking at the D1 interval, one can see that buyers regained control on this market. The price has broken above the local upward channel and after a short sideways move, index pushed higher. However, the upward move was halted at the key horizontal resistance area at 15,770 pts. The zone marked with red color is crucial for now - in case of a berak higher, the upward move may quickly reach all time highs near 16,000 pts. On the other hand, should the price stay below the aforementioned resistance, the downward correction may deepen. In such a scenario, the earlier broken area at 15,450 pts is considered to be the first key support.
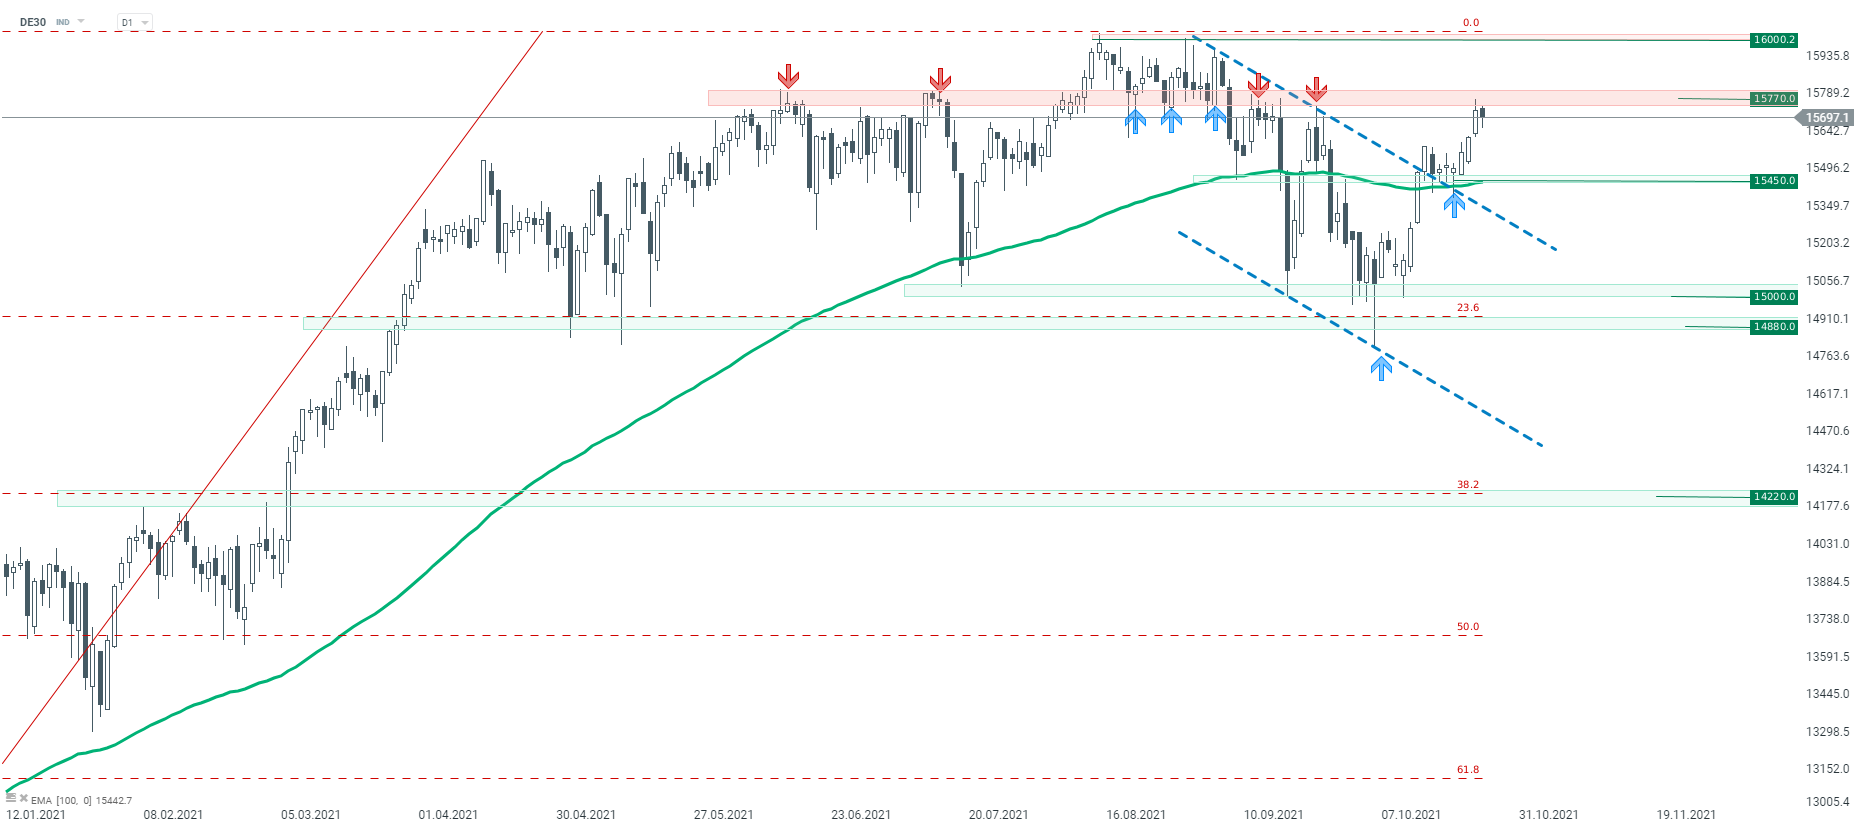 DE30 D1 interval. Source: xStation5

Daily Summary: Trump's War Threats Weigh on Markets. Wall Street Sinks into the Red
Tensions around Iran weigh on markets!

US Open: Alphabet and Tesla Weigh on Wall Street, While Oil Prices Renew Investor Concerns

Wheat climbs to the highest level since May 2024 🚜 Black Sea export risks fuel rally