


The S&P 500 has successfully recovered its losses from July, reaching a new historic high (ATH). The Nasdaq 100 continues to rebound as well, approaching its ATH at 4.6%. The growth is driven by two key factors:
- falling oil prices following reports that an agreement between the US and Iran regarding the opening of the Strait of Hormuz could be reached today or tomorrow;
- the rise in Palantir shares, which reported phenomenal results for the second quarter.
Both indices are also supported by a broader improvement in sentiment across global markets. Practically all key European indices are trading in the green today, from the German DAX (+0.7%) and the pan-European Euro Stoxx 50 (+0.8%), to the Polish WIG20 (+0.7%).
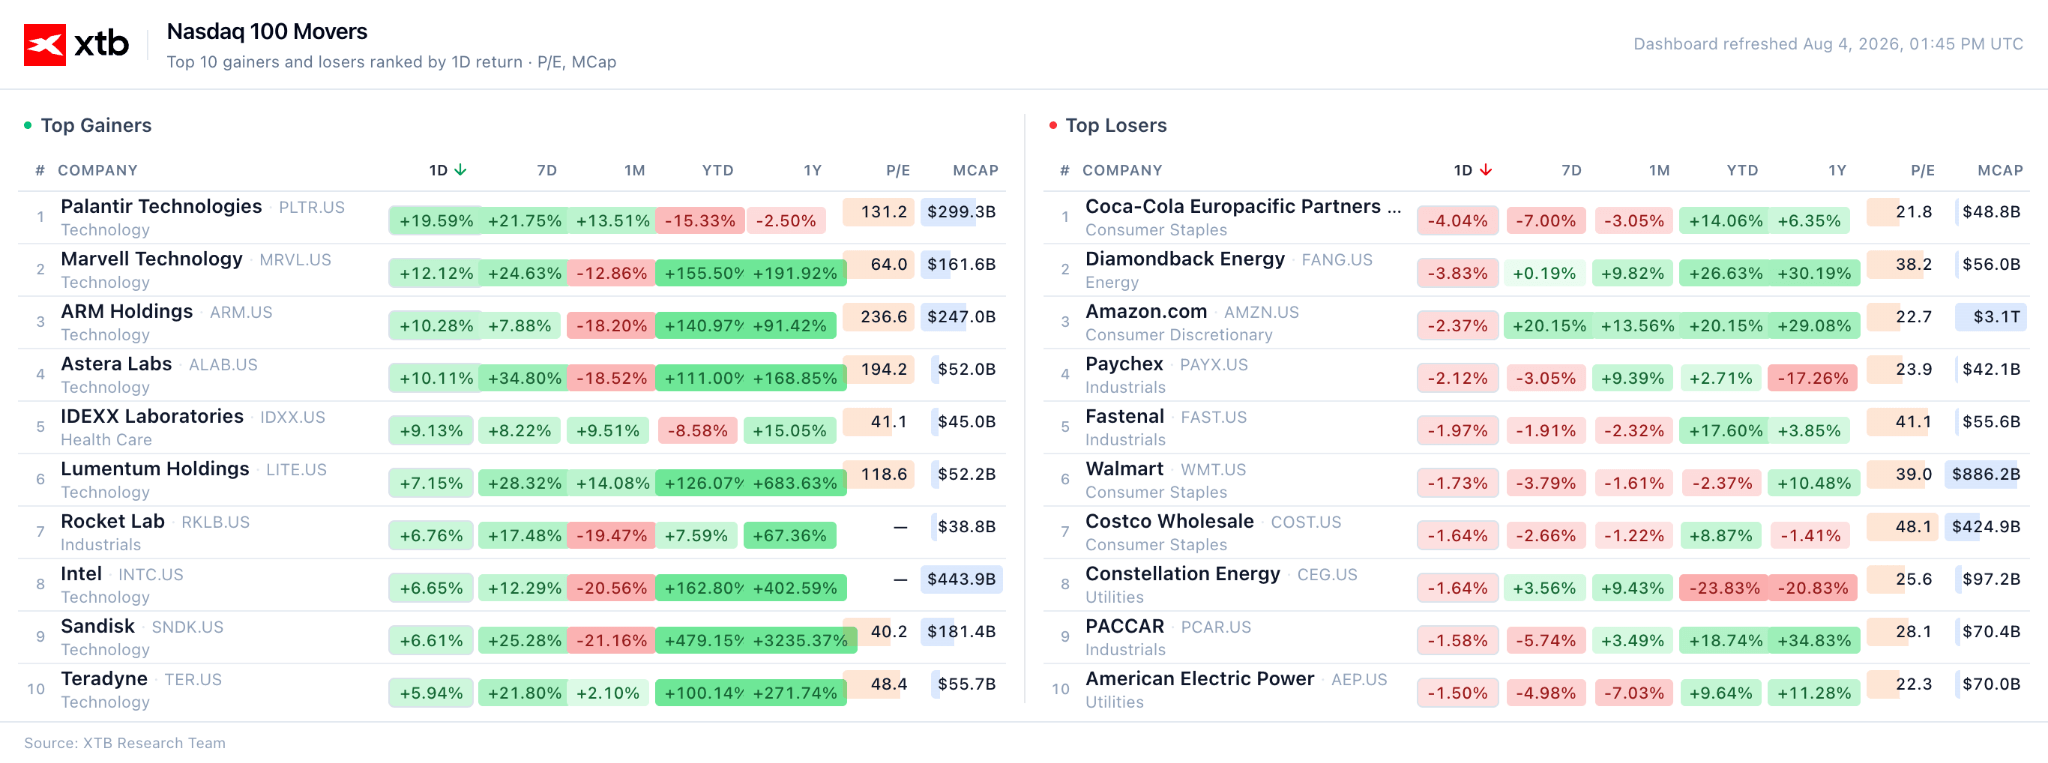
Figure 1: Winners and Losers in the Nasdaq 100 (04.08.2026)
 Source: XTB Research, 04.08.2026
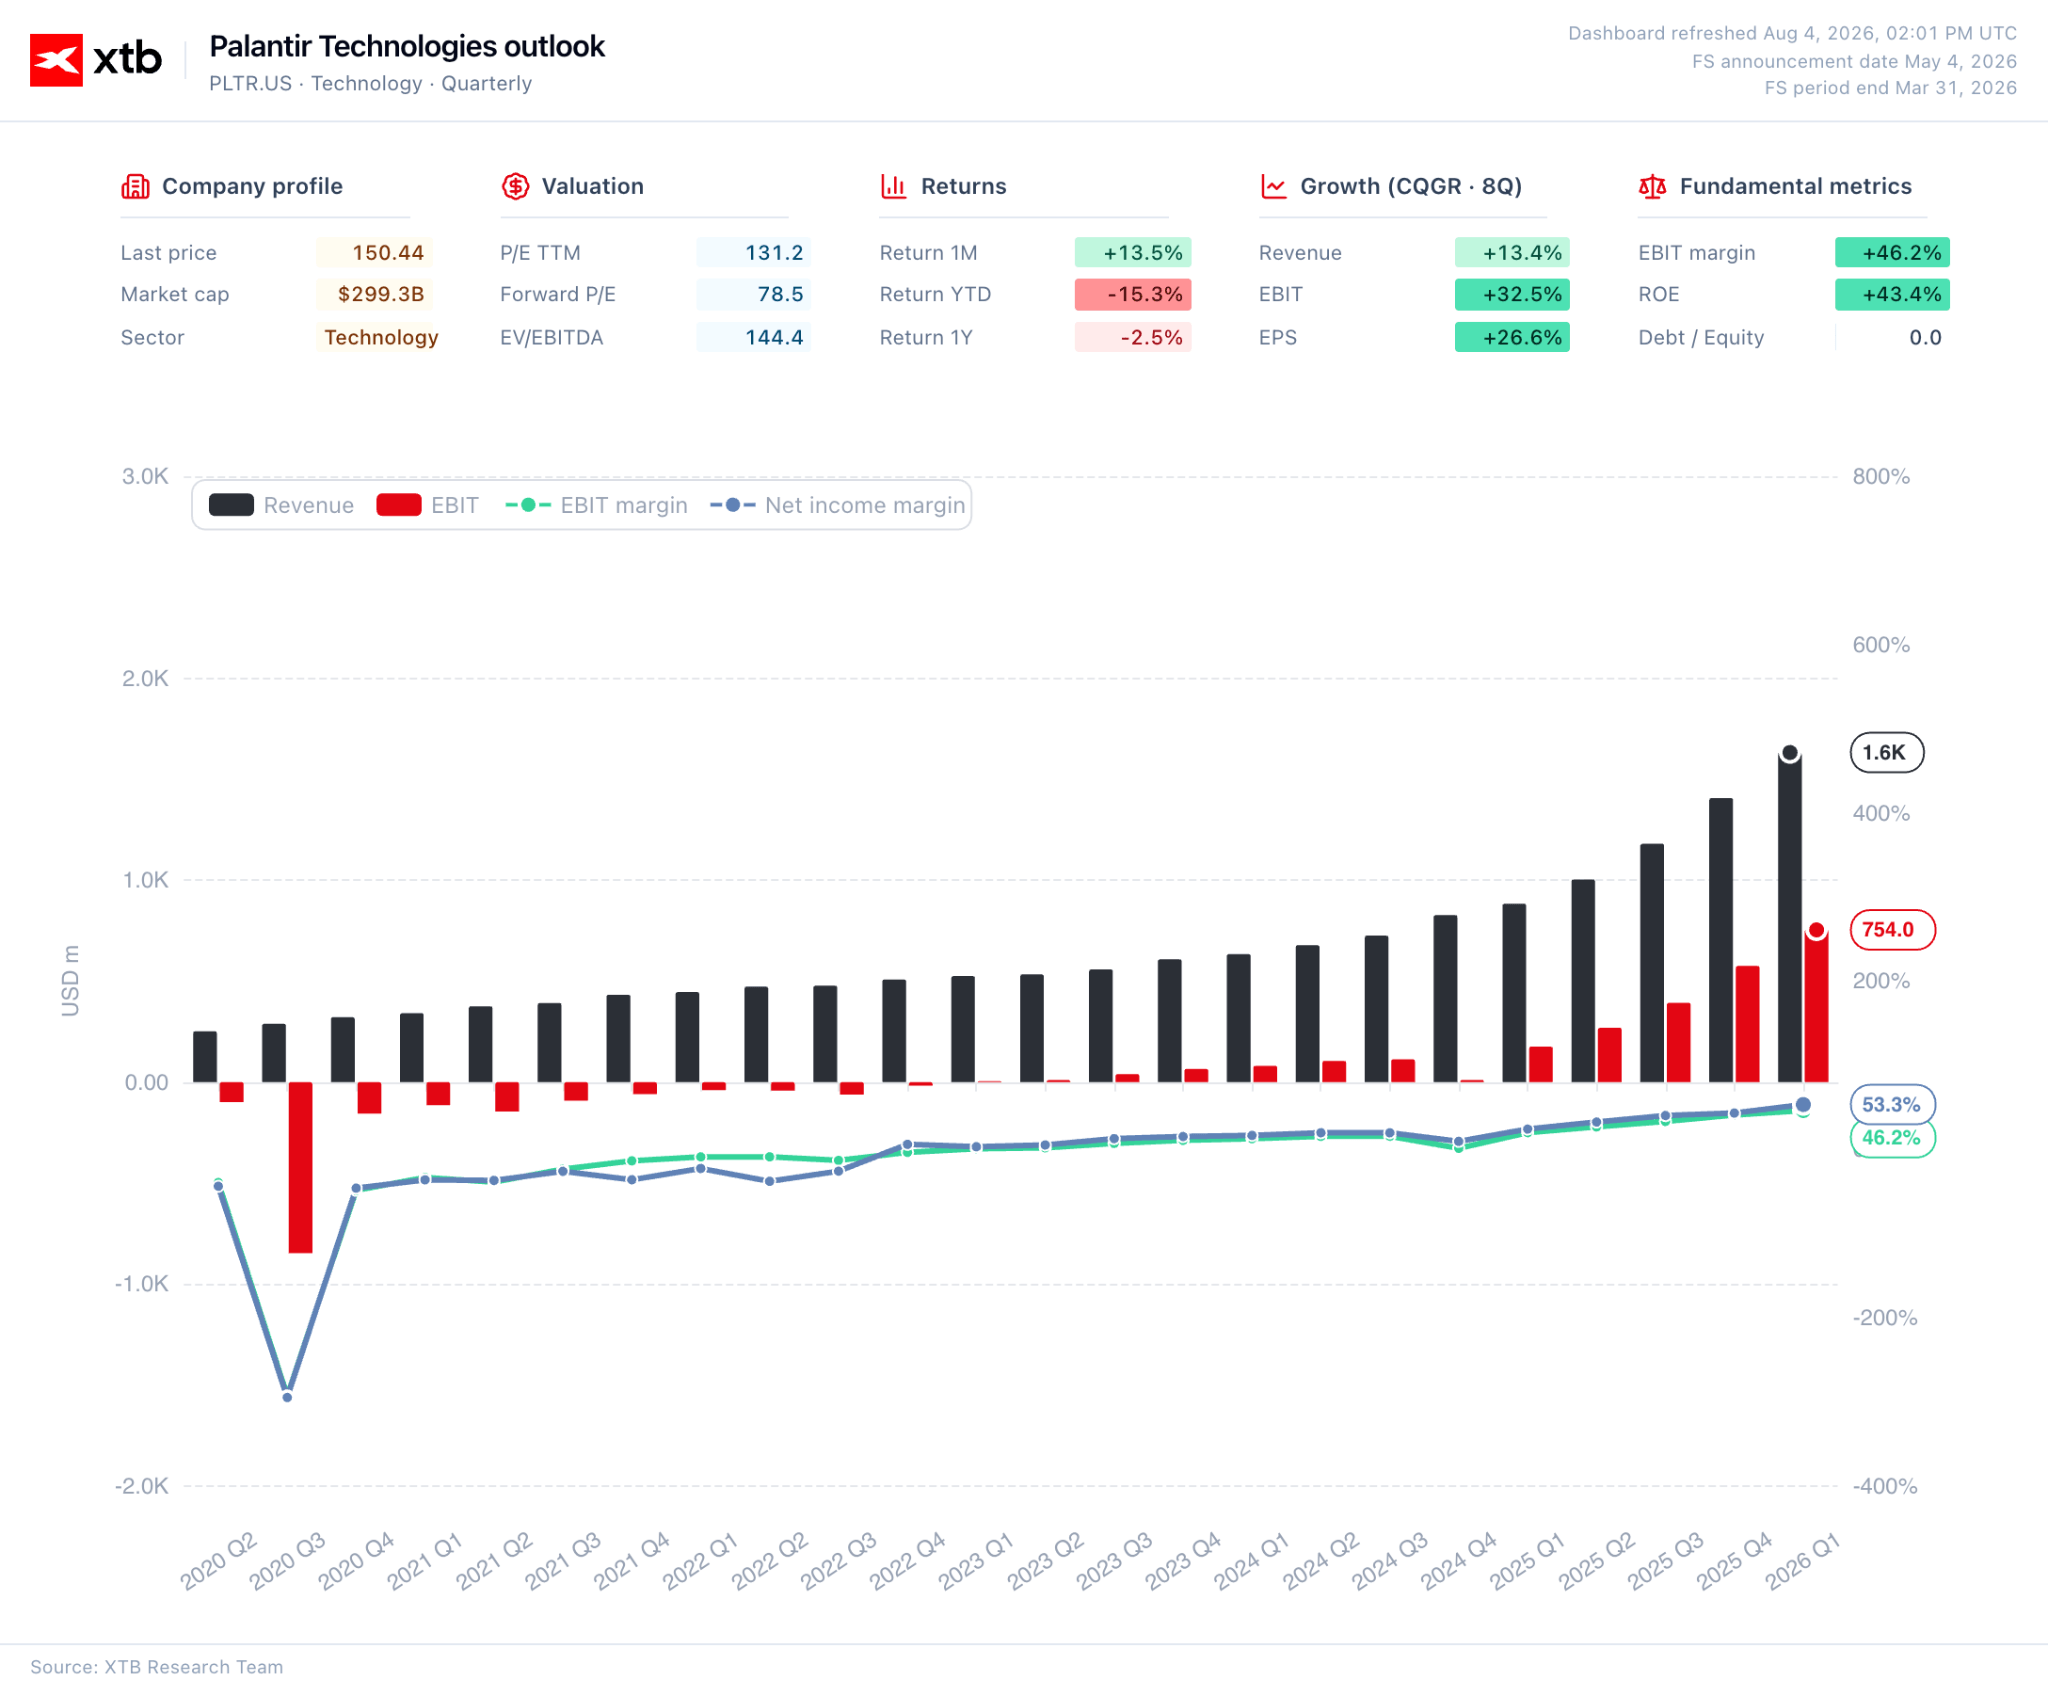
At the top of the list, we find the aforementioned Palantir, which is up by over 20% from Monday's opening levels. The results published by the company proved to be far better than expected, showing revenue growth to $1.94 billion (a 94% year-on-year increase) and EPS of $0.41 (an improvement of 256% compared to Q2 2025).
Figure 2: Dashboard for Palantir
 Source: XTB Research, 04.08.2026
Although investors have noted the increase in stock-based compensation and profits from investments in SpaceX, which, as with Alphabet, slightly distorted the picture of the return generated from the company's core business, the company's growth momentum remains extremely impressive. For Q3, the company expects revenue growth to reach $2.16 billion.
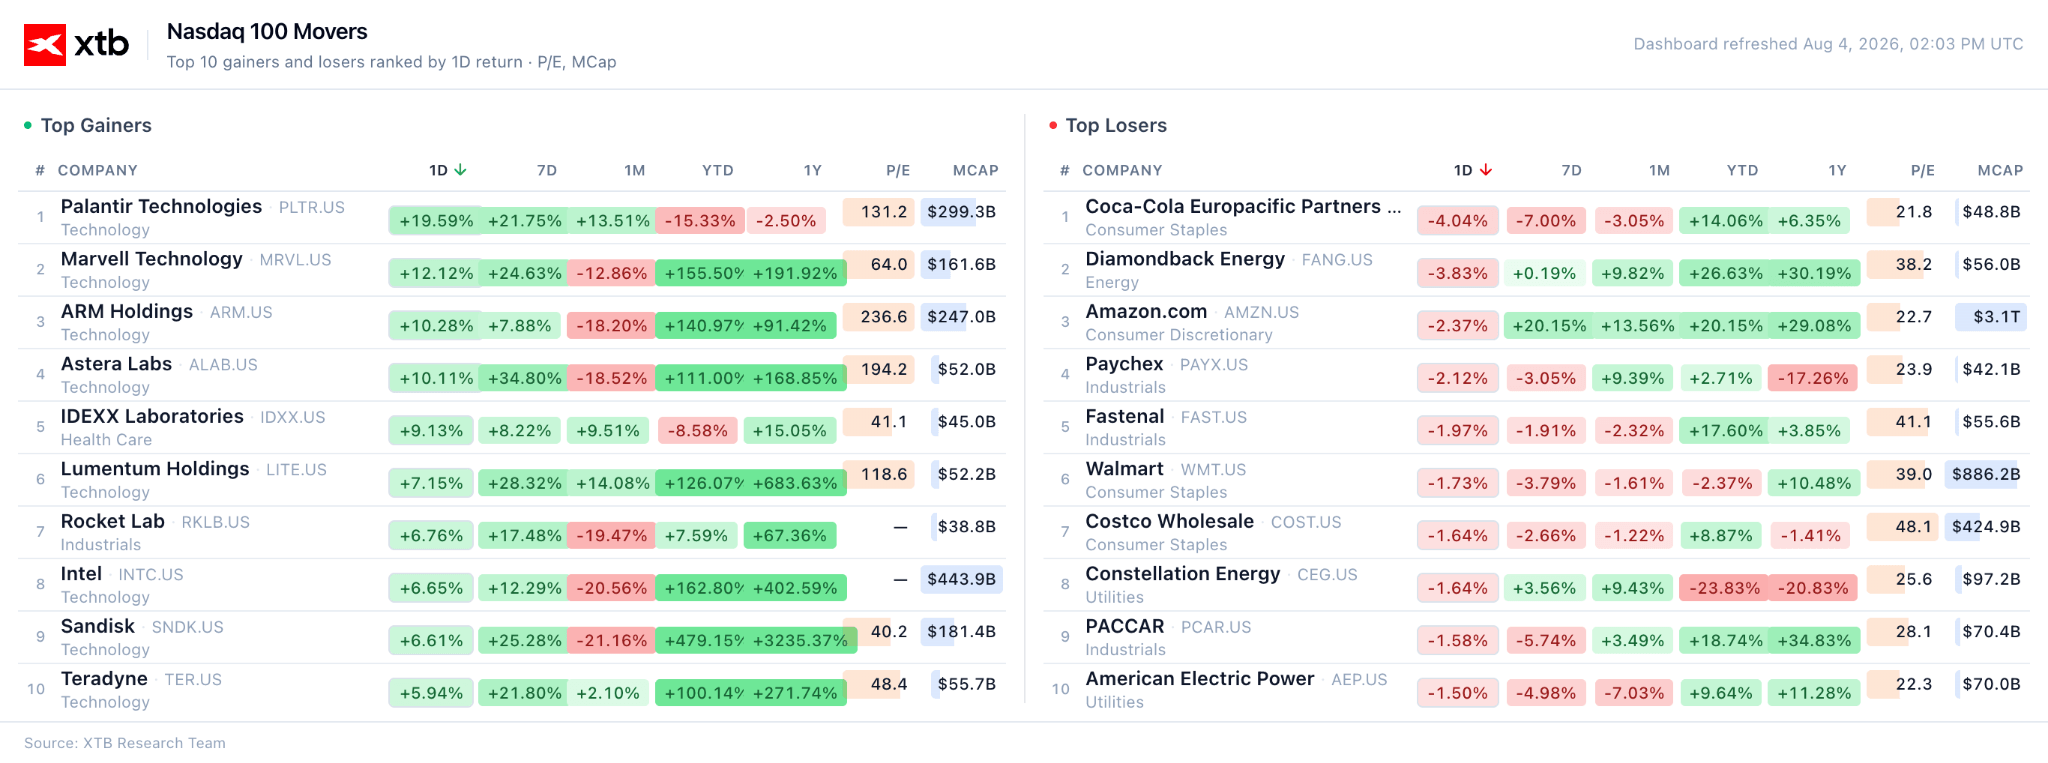
Figure 3: Winners and Losers in the Nasdaq 100 (04.08.2026)
 Source: XTB Research, 04.08.2026
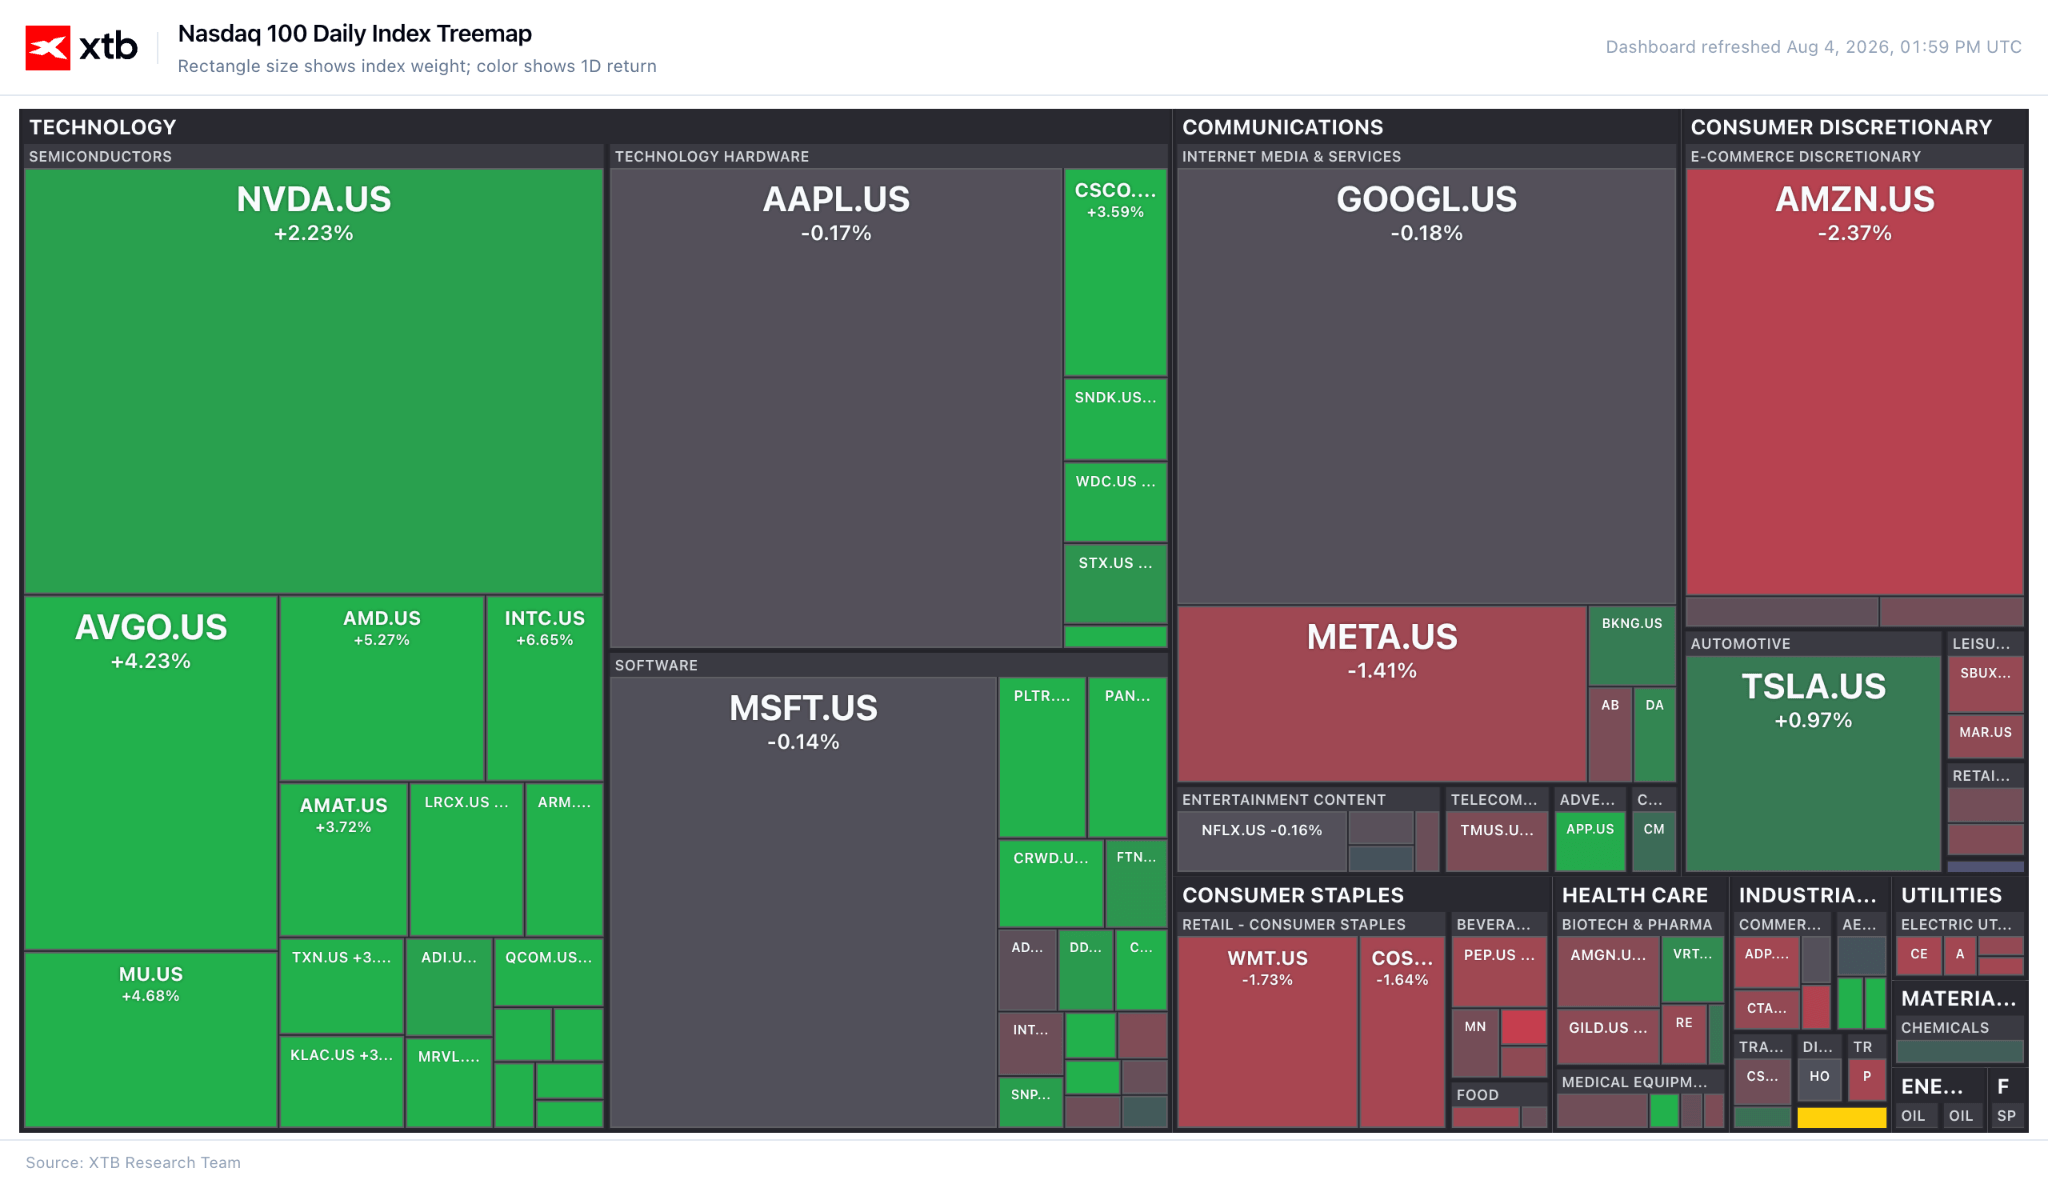
Companies from the semiconductor sector, which currently account for about a quarter of the entire Nasdaq 100 index, are also recovering August losses. Marvell is up 12%, ARM and Astera Labs are up 10%, while Intel and Sandisk are up 7%. Support comes from recent quarterly reports from hyperscalers, which showed unabated capital expenditure. In the case of the aforementioned Alphabet, CAPEX is expected to reach $200 billion in 2026. Smaller concerns about dynamic monetary policy tightening by the Fed are also favourable. However, all of the aforementioned companies are still significantly below their mid-July highs.
Figure 4: Heatmap for the Nasdaq 100 (04.08.2026)
 Source: XTB Research, 04.08.2026
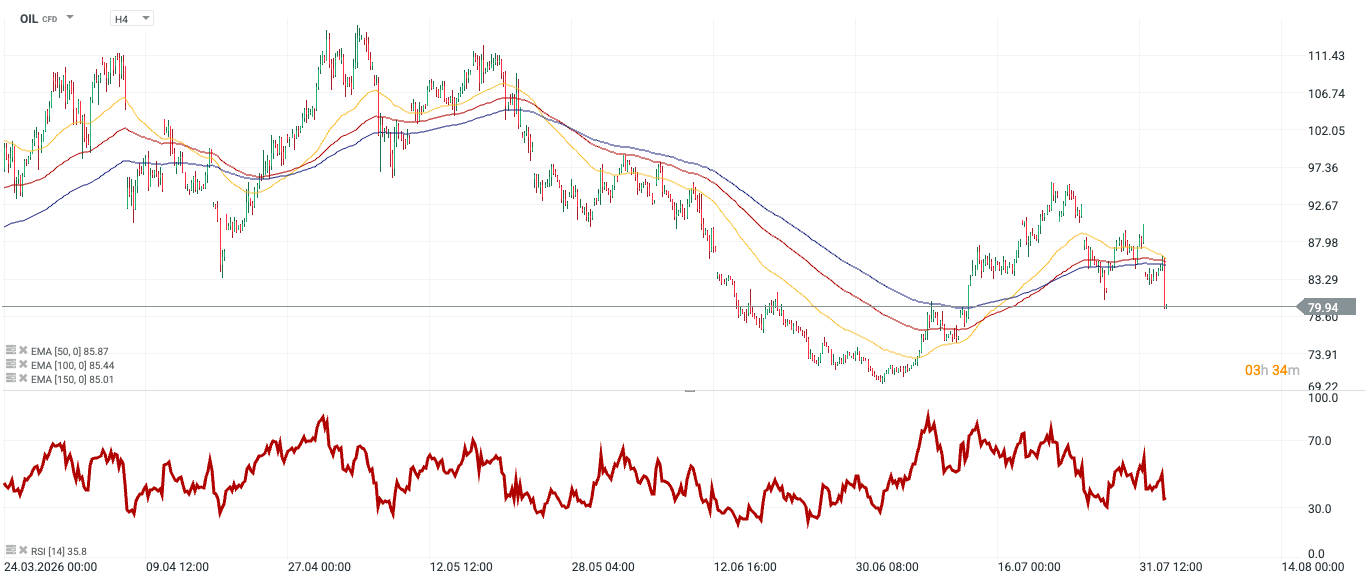
It is also impossible not to mention the falling prices of crude oil and gas. We currently have to pay less than $80 for a barrel of Brent, which is over 20% less than less than two weeks ago. We are observing a slightly smaller decline in LNG; MWh TTF currently costs less than $56 (11% down from the local peak on 24 July).
Lower energy commodity prices are primarily a consequence of the words of US Treasury Secretary Scott Bessent, who announced on CNBC that an agreement regarding the opening of the Strait of Hormuz could be reached today or tomorrow:
- "There is a chance that we will be able to reach an agreement on opening the strait and take steps towards greater normalisation of the situation in this conflict as early as today or tomorrow."
- "It is not just about energy. It is about fertilisers, refined products, and various industrial gases."
- "As these prices fall, we could see a significant increase in demand resulting from price relief."
Figure 5: Oil [H4] (24.03.2026 - 04.08.2026)
 Source: xStation, 04.08.2026
It is not just Palantir that has published results. We have also received a Q2 report from Pfizer. The revenue structure is changing; the share of non-COVID products is growing, which should certainly please investors. The company hopes that the acquisition of Metsera will allow it to build a position in the GLP-1 segment (obesity drugs).
Ahead of us are publications from SpaceX and AMD. Both will be released after the US market closes. The former will be the first serious test for the company, which debuted on the US stock exchange in June.
Technical analysis
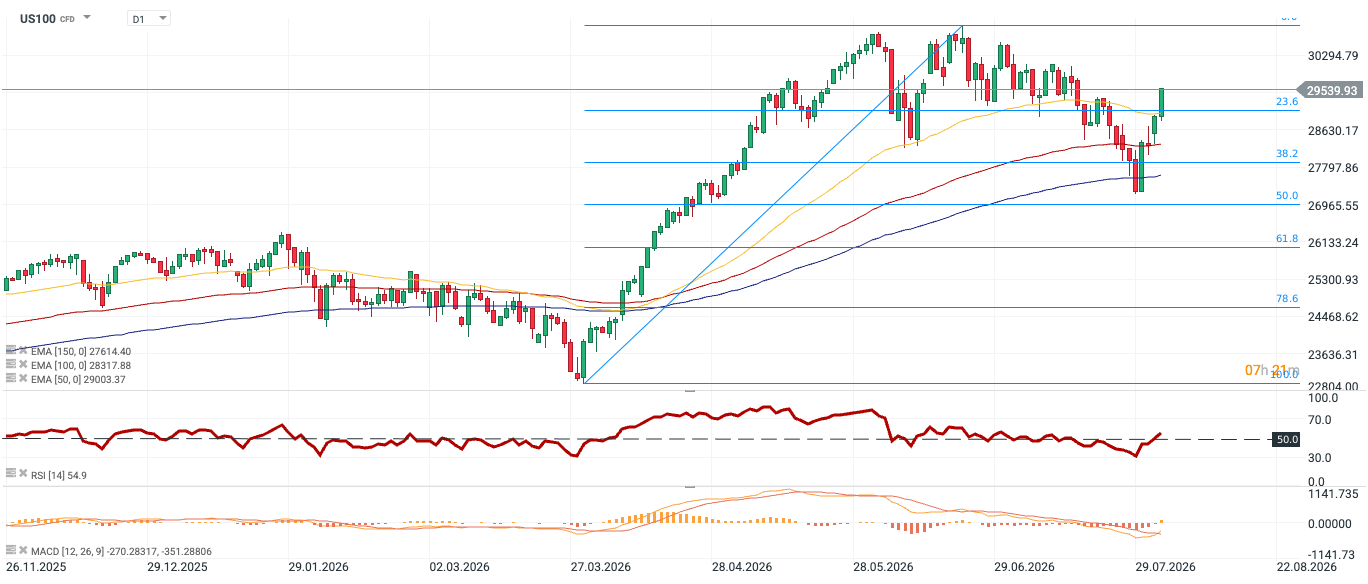
Figure 6: US100 [D1] (26.11.2025 - 04.08.2026)
 Source: xStation, 04.08.2026
The market is in a phase of dynamic rebound after a recent deep downward correction. Since March, a strong upward impulse has been observed, which gave way to a wave of sell-offs after establishing local highs. A key technical event of recent weeks was the halt of these declines slightly above the 50% Fibo level, determined from the last major upward wave, oscillating around 27,000 points.
The price action from recent sessions confirms the clear determination of the demand side. The quotes decisively broke through subsequent resistance levels from below, including the 23.6 retracement and all designated periodic moving averages (EMA 50, 100, and 150).
The 14-period RSI indicator, after a previous test of the oversold zone, recorded a steep upward movement, crossing the neutral barrier of 50 points and reaching a value of 54.9.
The immediate technical target for the demand at this moment is an attack on the last highs, located above the psychological boundary of 30,000 points. In the event of a local correction of this impulse, the first line of defence will be the recently regained EMA 50 and EMA 100 levels. Only their renewed, permanent break downwards could negate the current pro-growth market outlook.



Daily Summary: Oil at five-month highs, indices under pressure (23.10.2026)


BREAKING: France slows down, Germany holds on. Euro falls below 1.12



Daily Summary: Valuations Under Pressure, Capital Moves Away From Technology

Market Wrap: "Decent" results are not enough – tech stocks fall further; oil highest since May (22.10.2026)