



US producer price inflation came in slightly below expectations in October on an annual basis, while core PPI was in line with consensus. A sharp slowdown in monthly price growth compared with September suggests easing near-term price pressures, although annual producer inflation remains elevated. Following the release, US Dollar Index futures edged lower, while Wall Street index futures, including US500, moved higher.
-
US PPI YoY: 6.5% vs. 6.6% forecast and 6.3% previously.
-
US PPI MoM: 0.3% vs. 0.4% forecast and 1.3% previously (revised from 1.4%).
-
US Core PPI YoY: 5% vs. 5.0% forecast and 5% previously.
-
US Core PPI MoM: 0.3% vs. 0.3% forecast and 0.7% previously (revised from 0.8%).
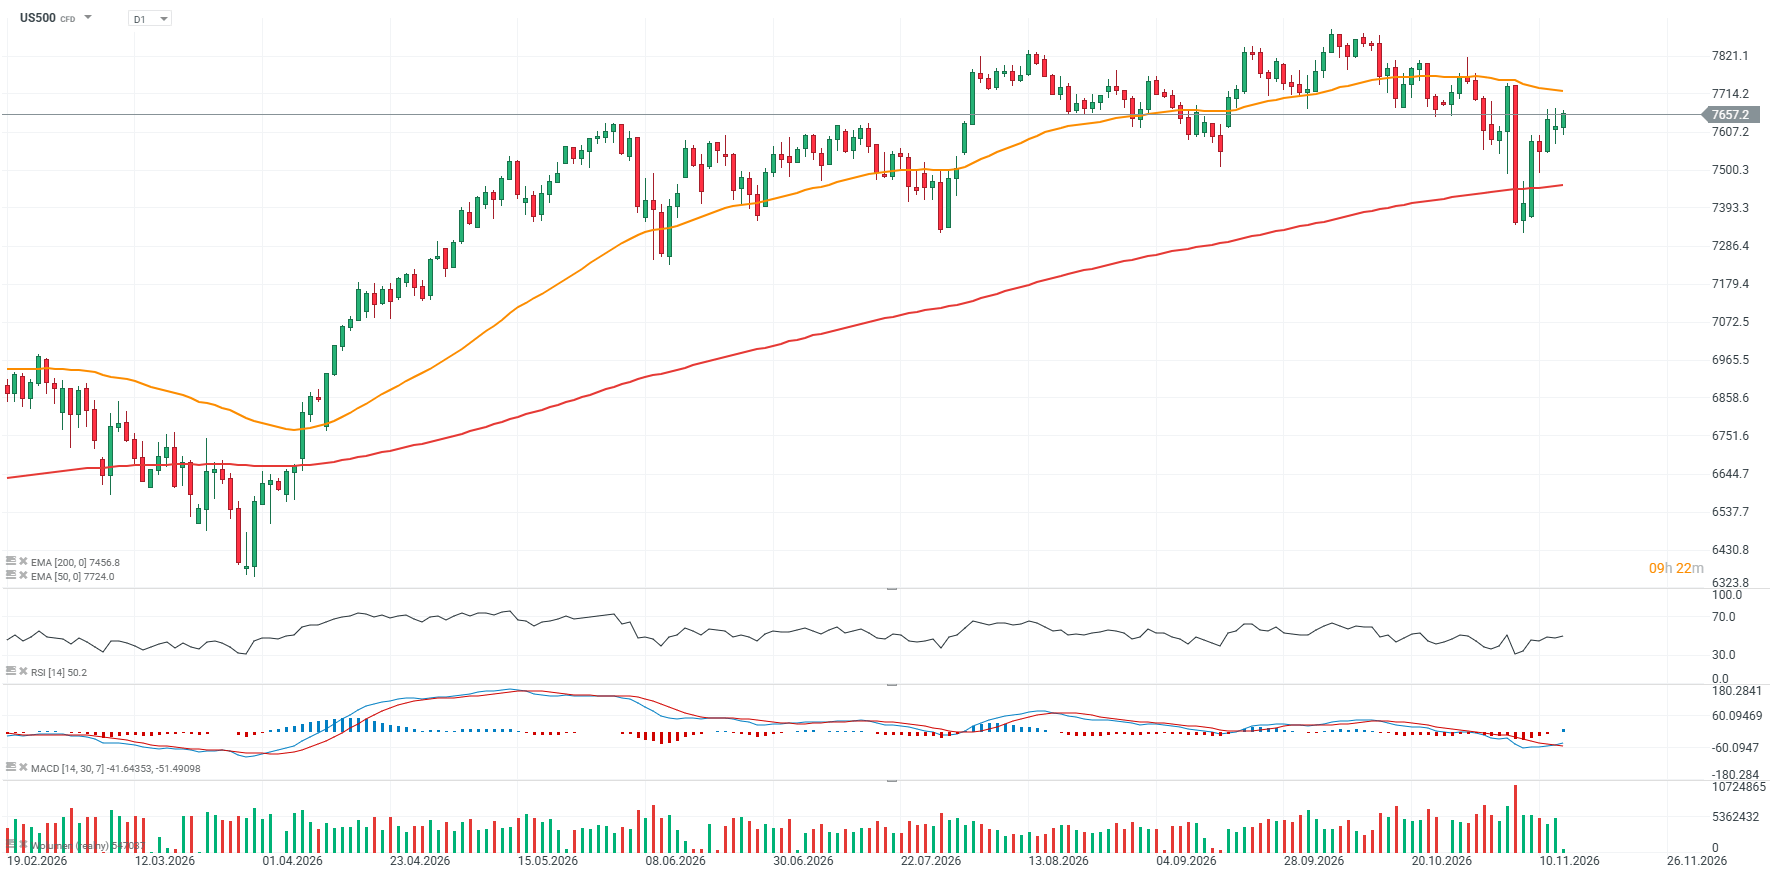
US500 (D1 Chart)
S&P 500 futures are rising for the third consecutive session and are approaching a test of the 50-session exponential moving average (EMA50, orange line). Key resistance is located at 7,715 points, while key support stands at 7,300 points.
 Source: XTB
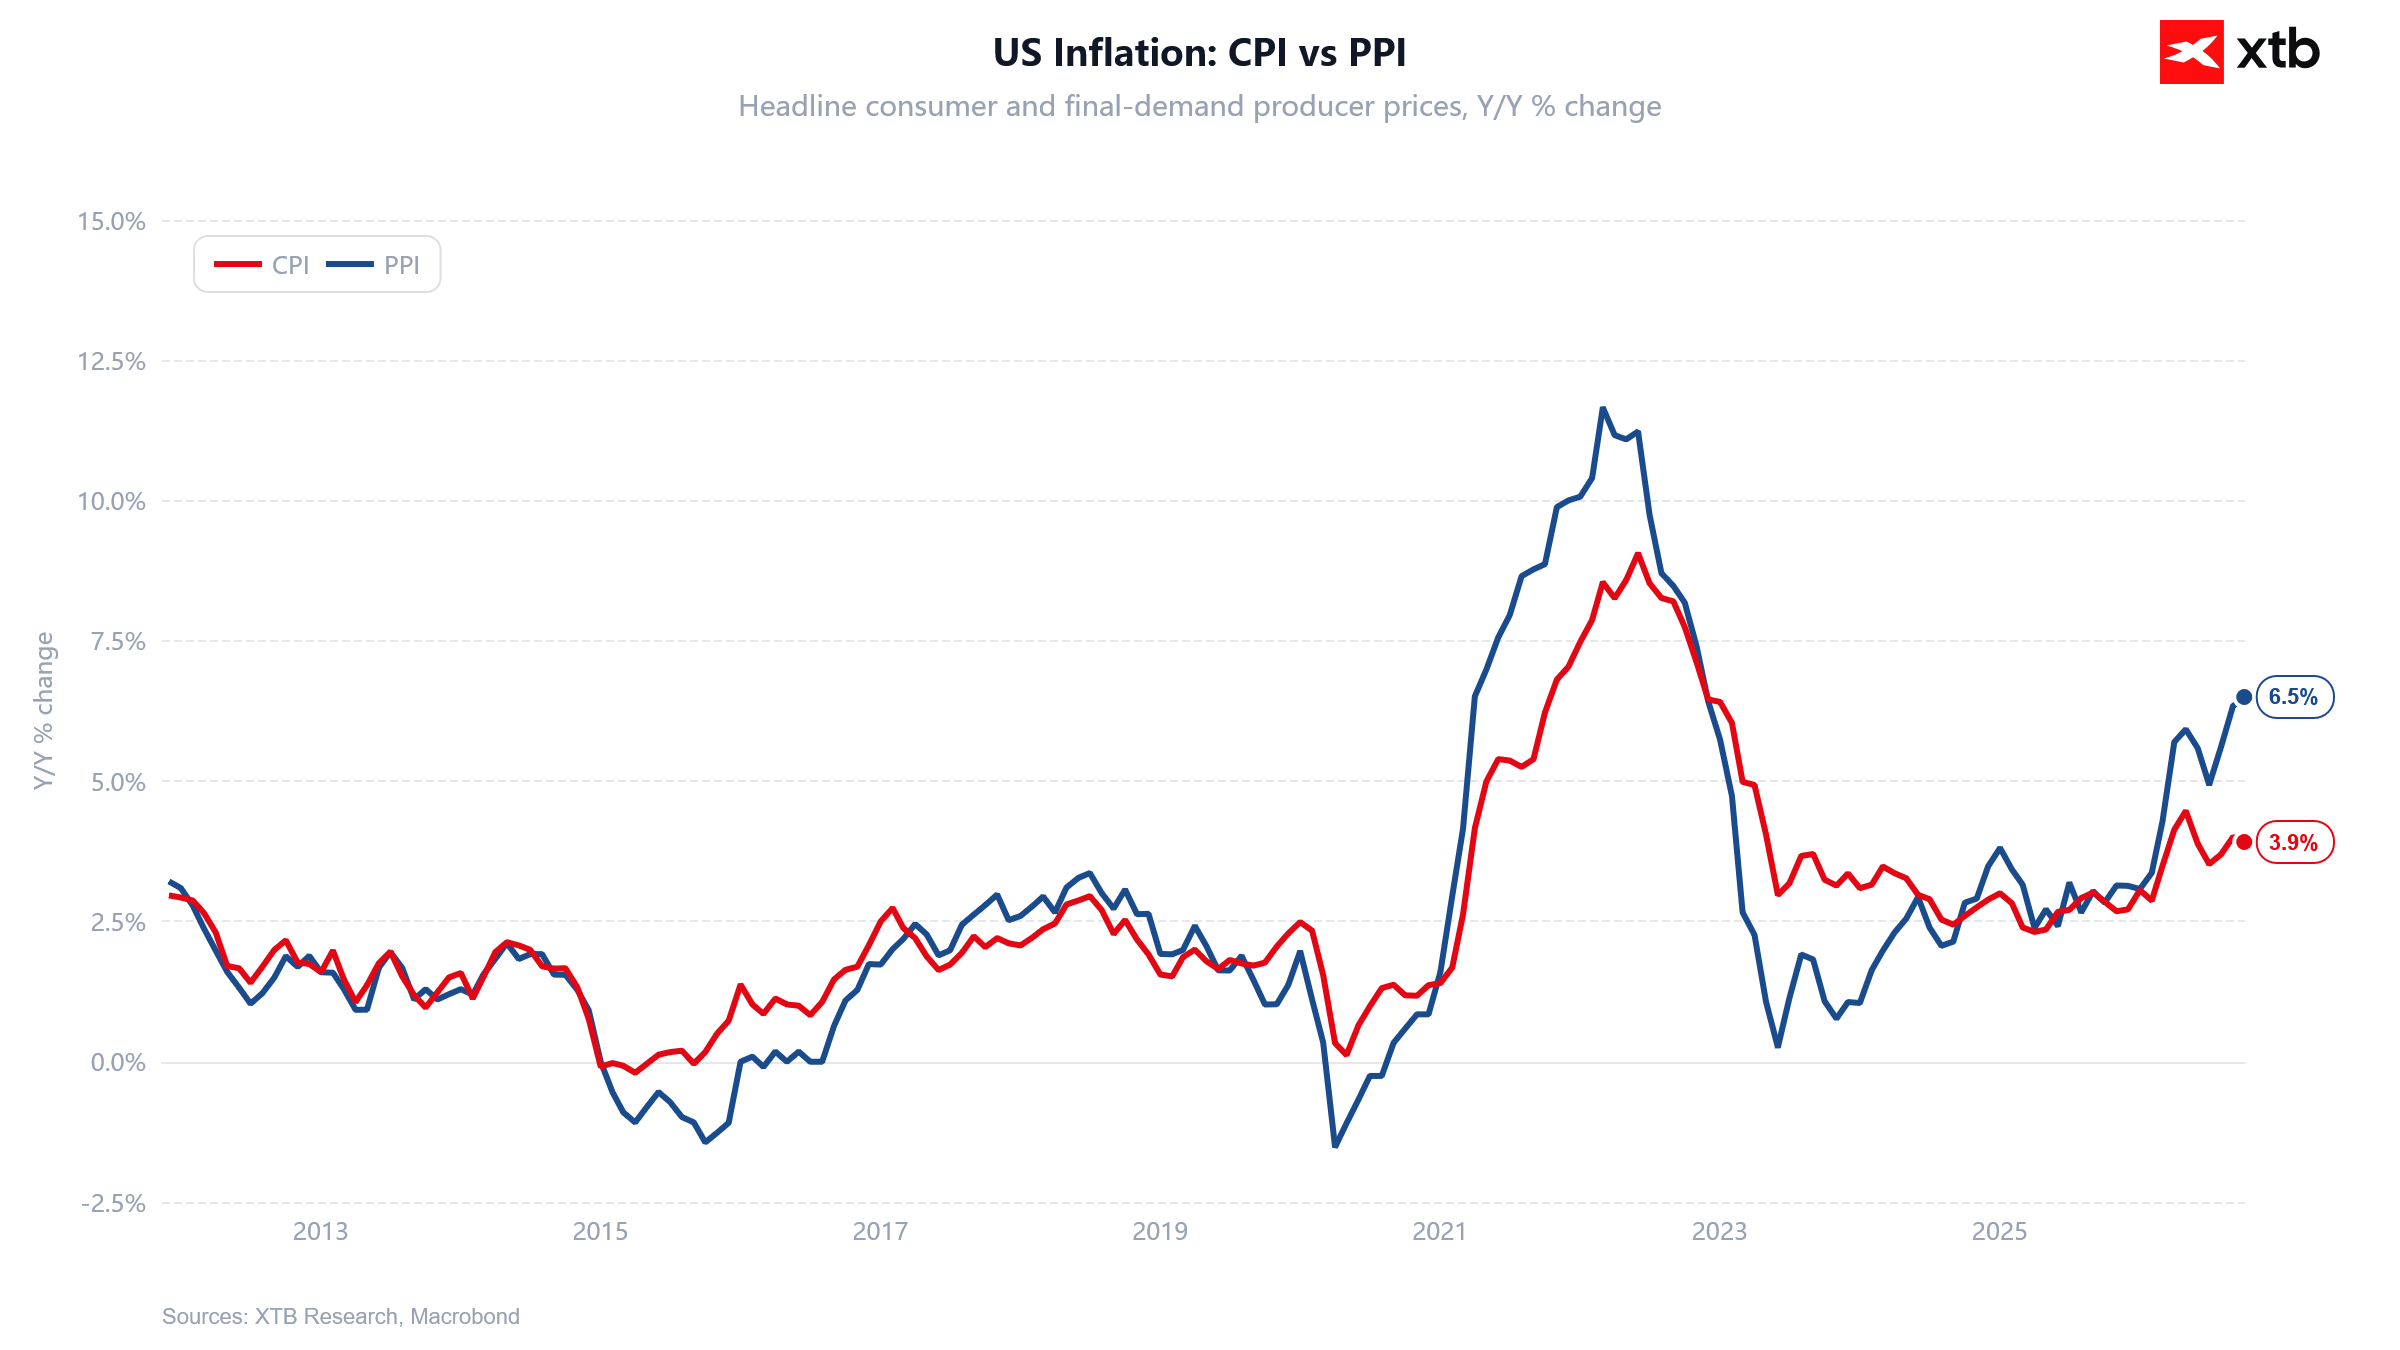
US producer price inflation (PPI) rose to 6.5% YoY in October, significantly exceeding consumer price inflation (CPI) of 3.9%. Such a wide gap between the two indicators suggests persistent cost pressures among producers, which could eventually be passed on to consumers. Elevated PPI increases the risk of persistent inflation in the US and could limit the Fed's room to ease monetary policy.
Source: XTB



Morning Wrap - Will the markets recover from the scandal involving Nvidia's ousted CEO❓

Daily Summary: Oil Rebounds, EURUSD Falls Sharply 🗽 Wall Street Stabilizes After Nvidia Sell-Off


Oil Gains Nearly 2% Despite a Sharp Rise in US Inventories 📈


USDJPY Pulls Back After Reaching 160 🚩 Is Tokyo Intervening in the Yen Again?