


US futures started the week in the green, however after the launch of the trading session at 02:30 GMT, sellers regained control. Russell 2000 (US2000) is currently the weakest performer among major US indices, with declines of more than 1%. Looking from a technical point of view at the D1 interval, upward move stalled at the key resistance at 161.8% Fibonacci retracement. If the downward correction deepens, then support at 2028 pts could be at risk. This level is marked with a lower limit of the 1:1 structure and local high from December 28.
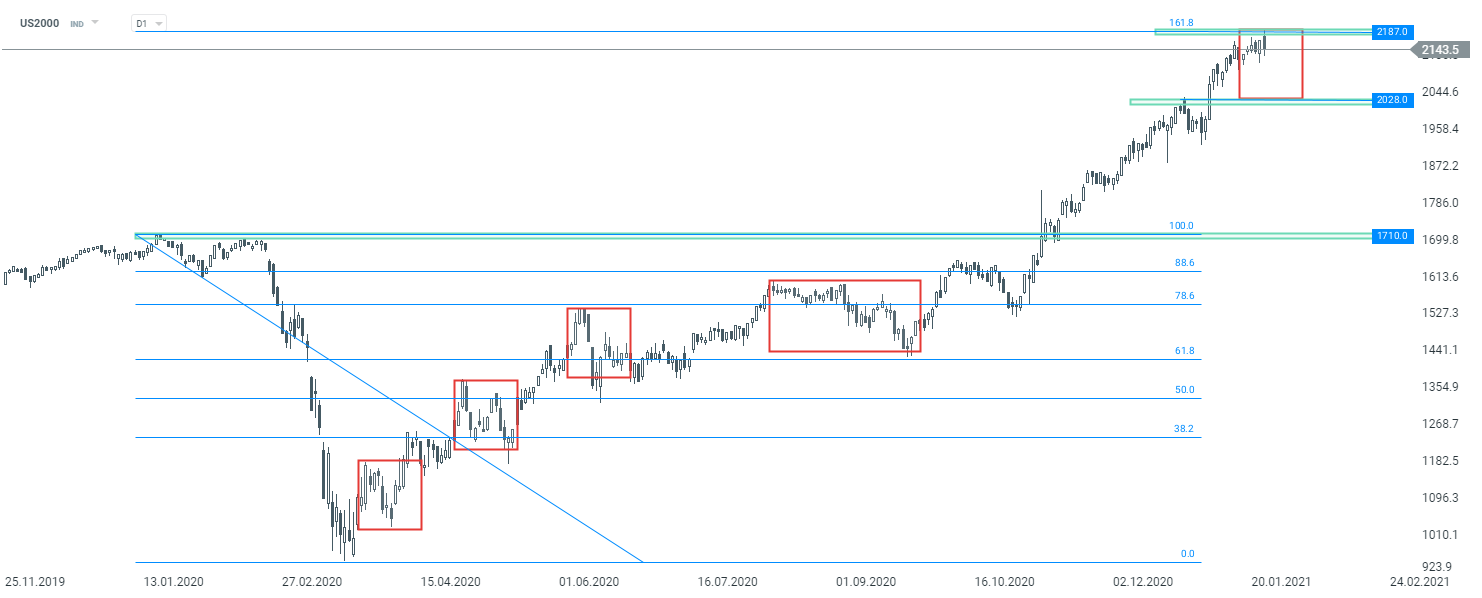 US2000 interval D1. Source: xStation5

Chart of the Day: Nasdaq 100 Slips Into Correction 📉 AI Rally Loses Steam - What’s Next for US100? (03.11.2026)


Morning wrap: Stock Indices Fall Again 🚩 Oil Tries To Rebound Following US Strike on Iran’s Qeshm Island (03.11.2026)



Daily Summary: A Rollercoaster Ride in the Commodities Market🚨Oil Drops 7%; Gold Rallies Over 2%💥


What's next for the S&P 500? 🗽 U.S. Earnings Season Summary