



The new week started with the strength of the US dollar against major currencies, while yields continue to rise and US indices are under pressure once again. On the other hand, the FED continues to ignore the current situation.
Looking at eur/usd on a 4-hour time frame chart, we can see that the price has broken below the corrective channel and has made a new relative low and the bearish pressure remains in the euro.
However, also we can look at RSI that is showing signs of oversold in the short term and could justify a correction of the recent bearish momentum. In addition, the chart below shows that USD is losing is losing strength in the short term and may reinforce the possibility of a EUR / USD recovery.
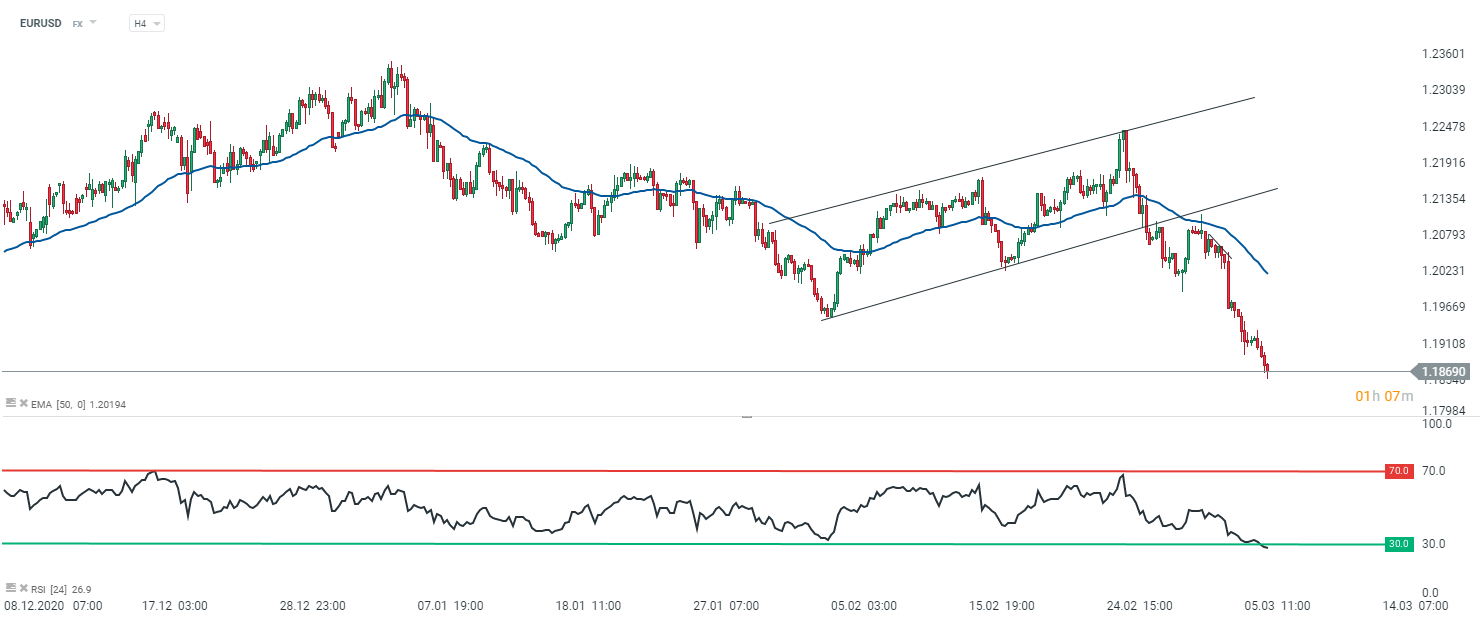
Eur/usd, timeframe 4H. Source: xStation
As we can see in the chart below, USD and GBP have the best performance, while NZD and EUR have the worst performance.
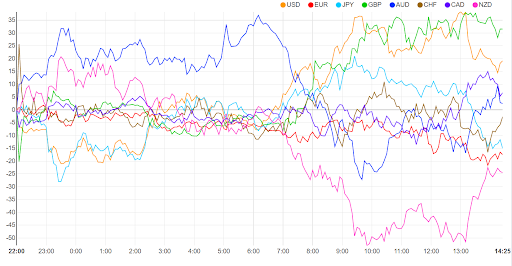
Source: currency-strength.com
Henrique Tomé, XTB Portugal



Daily Summary: A Rollercoaster Ride in the Commodities Market🚨Oil Drops 7%; Gold Rallies Over 2%💥



📊Morning Wrap: Oil falls after Qatar talks. China injects liquidity, while the US prepares for elections.



🔴Three Markets to Watch Next Week: US500, BITCOIN, EURUSD (30.10.2026)


Chart of the Day: USDJPY After Fed and BoJ decisions. Is Japan getting closer to another rate Hhike?