
The EUR/USD pair has become particularly volatile over the past few sessions. After the euro reached new highs this year against the US dollar, nearing 1.12 euros, the pair eventually started to decline again.
However, when we analyze the currency pair on the daily chart, we can see that the price has been slowing down, and the buying strength is picking up near the 50-period EMA (Exponential Moving Average). This will be an important zone to understand whether the euro might (or might not) resume its upward trend against the US dollar.
 EUR/USD, Daily Time Frame Chart. Source: xStation 5
Curiously, when we analyze the chart of the US dollar index, we can see that the index is also testing the 50-period moving average on the D1 (daily) chart.
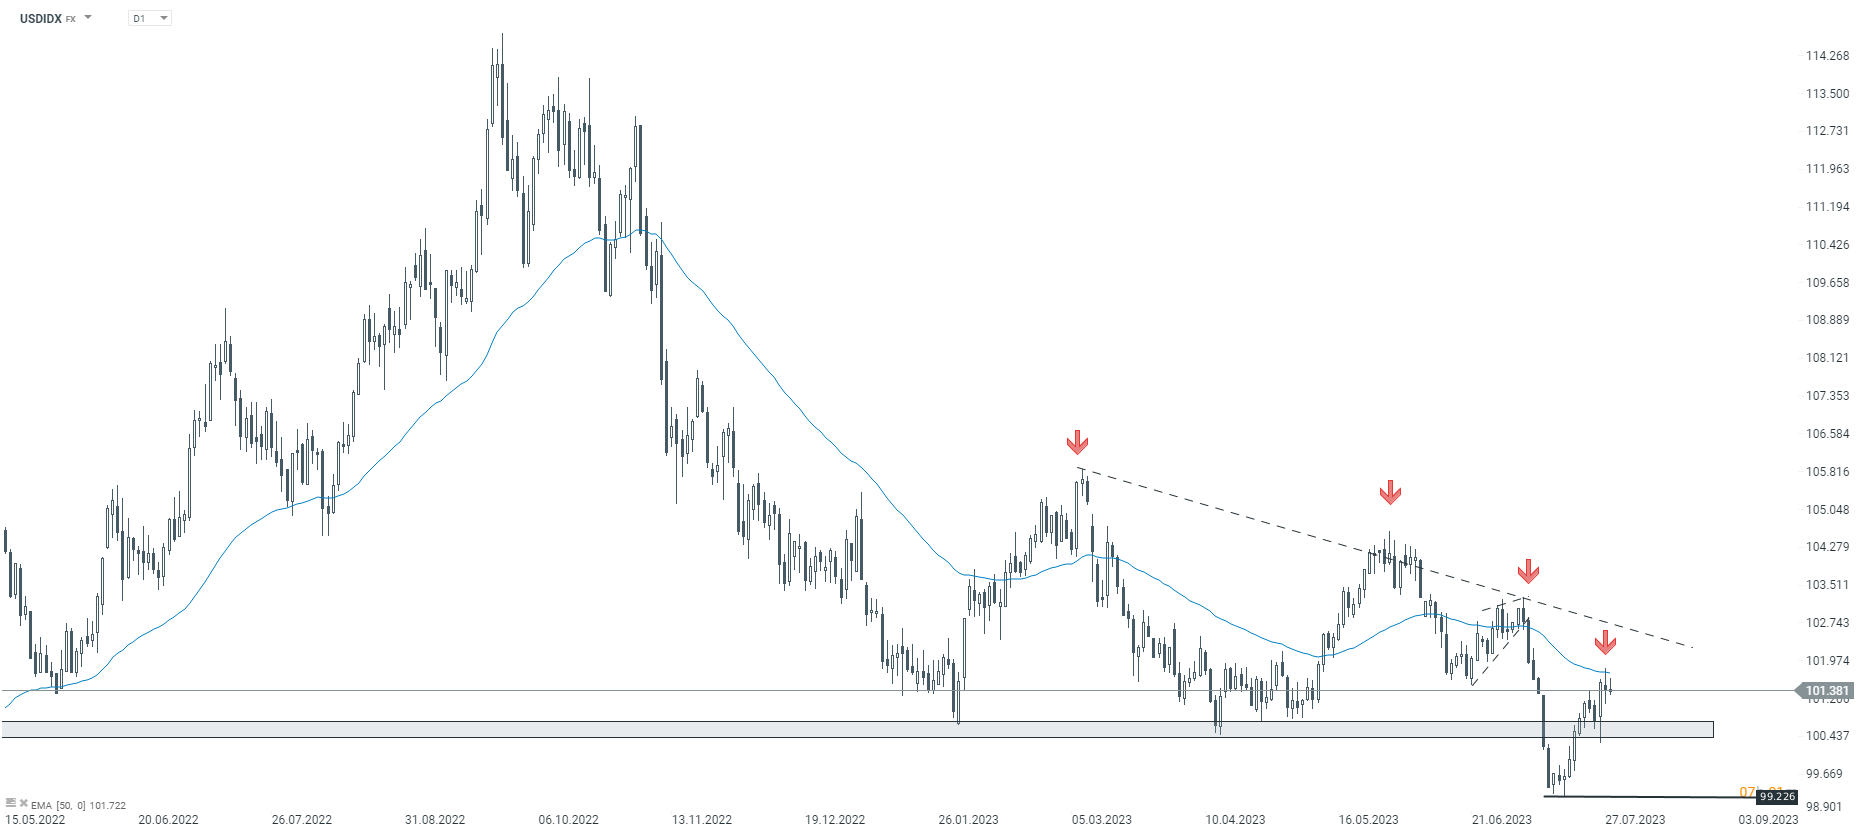 USDIDX, Daily time frame Chart. Source: xStation 5
Henrique Tomé,
Analyst at XTB Portugal

Daily Summary: Equities Diverge as Tech Lags, Europe Rallies on Earnings & PMIs (24.07.2026)

Three markets to watch next week (24.07.2026)

BREAKING: Eurozone recovery? Positive PMI data tempered by high oil and gas prices

Economic Calendar: Industry’s condition in the shadow of oil prices