
Understand what an income statement (P&L) is, what it includes, and how to analyze revenue, expenses, and net income to assess a company's profitability as an investor.
Understand what an income statement (P&L) is, what it includes, and how to analyze revenue, expenses, and net income to assess a company's profitability as an investor.


The income statement is a financial report showing a company's revenue, expenses, and profit or loss over a specific accounting period, also known as a profit and loss statement. The bottom line of this report always shows the net income, such as a hypothetical $10 million profit for a given quarter. Investors use the income statement to track performance from top-line sales to the final profit, as breaking down its lines reveals the true financial health of the business.
- An income statement and a profit and loss statement (P&L) are the exact same document.
- The main components include revenue, cost of goods sold, operating expenses, and net income.
- The basic formula calculates net income by subtracting total expenses from total revenue.
- While the income statement tracks a period, the balance sheet measures a single point in time, and the cash flow statement tracks actual cash movements.
What is an income statement?
The income statement, also known as a profit and loss statement (P&L), is one of the three financial statements defined under IAS 1 (Presentation of Financial Statements) and required in regulatory filings such as the SEC 10-K and 10-Q. It shows a company's revenue, expenses, and profit or loss over a specific accounting period.
Investors often wonder whether an income statement differs from a profit and loss statement. They are exactly the same document, and terms like statement of operations are used interchangeably to describe this report. Knowing that they are synonyms eliminates confusion when researching different companies.
The income statement covers a defined timeframe, such as a quarter or a full fiscal year. This time-bound nature sets the income statement apart from reports that capture a single moment. The document concludes with the "bottom line," which represents the final net income or net loss generated during that accounting period.
What are the components of an income statement?
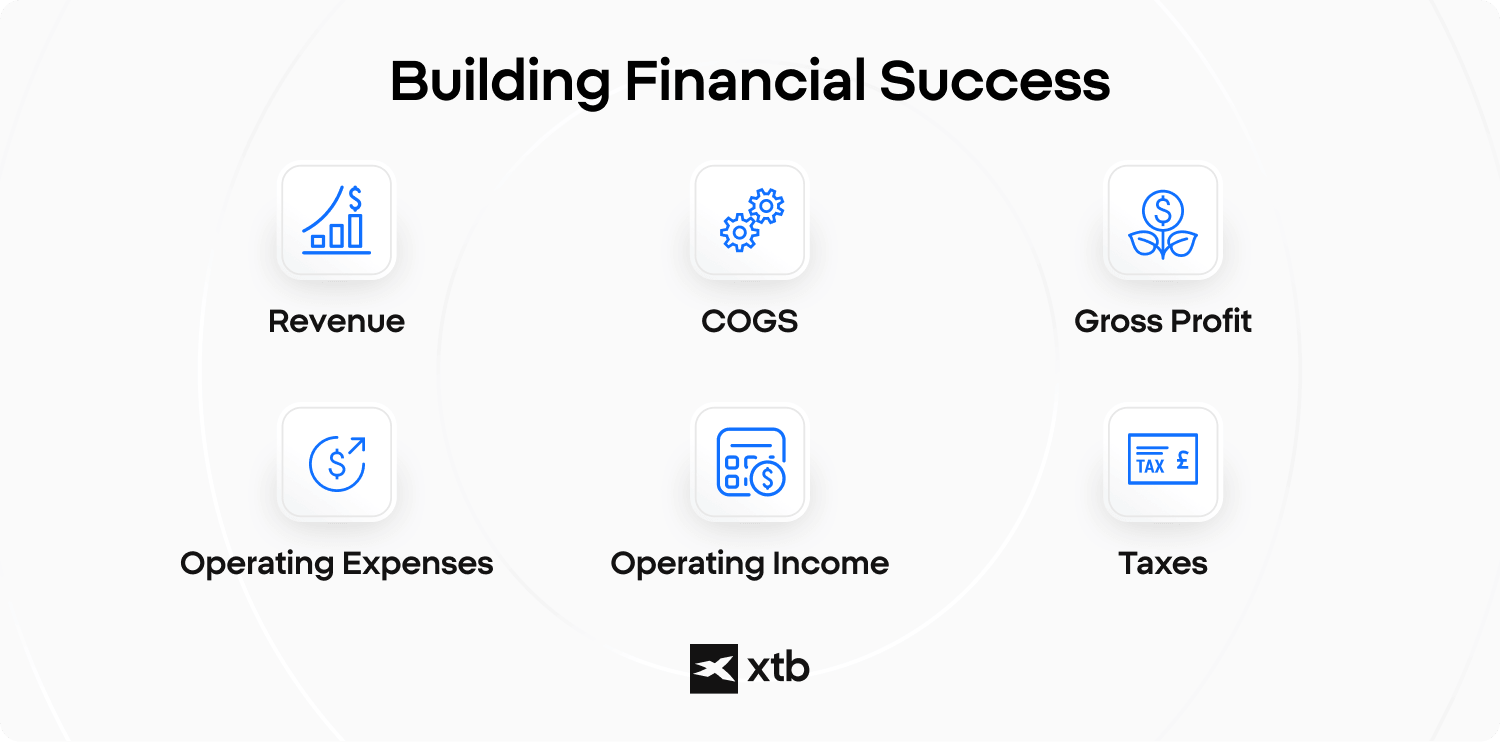
An income statement consists of several core lines: revenue (sales), cost of goods sold (COGS), gross profit, operating expenses, operating income, taxes, and net income. Reading the financial statements requires understanding what each specific line item represents. The primary components of an income statement include:
- Revenue: The top line showing the total money brought in by sales or services.
- Cost of goods sold (COGS): The direct costs attributable to the production of the goods sold by a company.
- Gross profit: The result of subtracting COGS from total revenue.
- Operating expenses: The costs required to run the daily operations, such as selling, general, and administrative expenses.
- Operating income: The profit realized from a business's operations, calculated before interest and taxes.
- Net income: The final bottom line showing the actual profit or loss after all expenses, interest, and taxes are deducted.
Some sources classify the income statement into four basic accounting elements: revenue, expenses, gains, and losses. Net income serves as the fifth element, representing the mathematical result of these categories combined.
How to read an income statement?
You read an income statement from top (revenue) to bottom (net income), where each subsequent line subtracts a specific type of expense to show profitability at different levels.
The process of analyzing the report starts with the "top line," which is the total sales generated. From there, you subtract direct production costs to find the gross profit. Continuing downwards, operating expenses are deducted to reveal the operating income, which shows how well the core business performs before external financial obligations.
Extracting margins from the income statement provides strong signals about a company's efficiency. The gross margin, operating margin, and net margin indicate the percentage of revenue retained at each step. For example, a gross margin of 40% means the company keeps $0.40 for every dollar of sales after direct costs.
Companies present this data using either a single-step or multi-step format. The multi-step income statement separates operational revenues and expenses from non-operational ones, offering a deeper view of how to read financial statements.
Reading the income statement like an investor
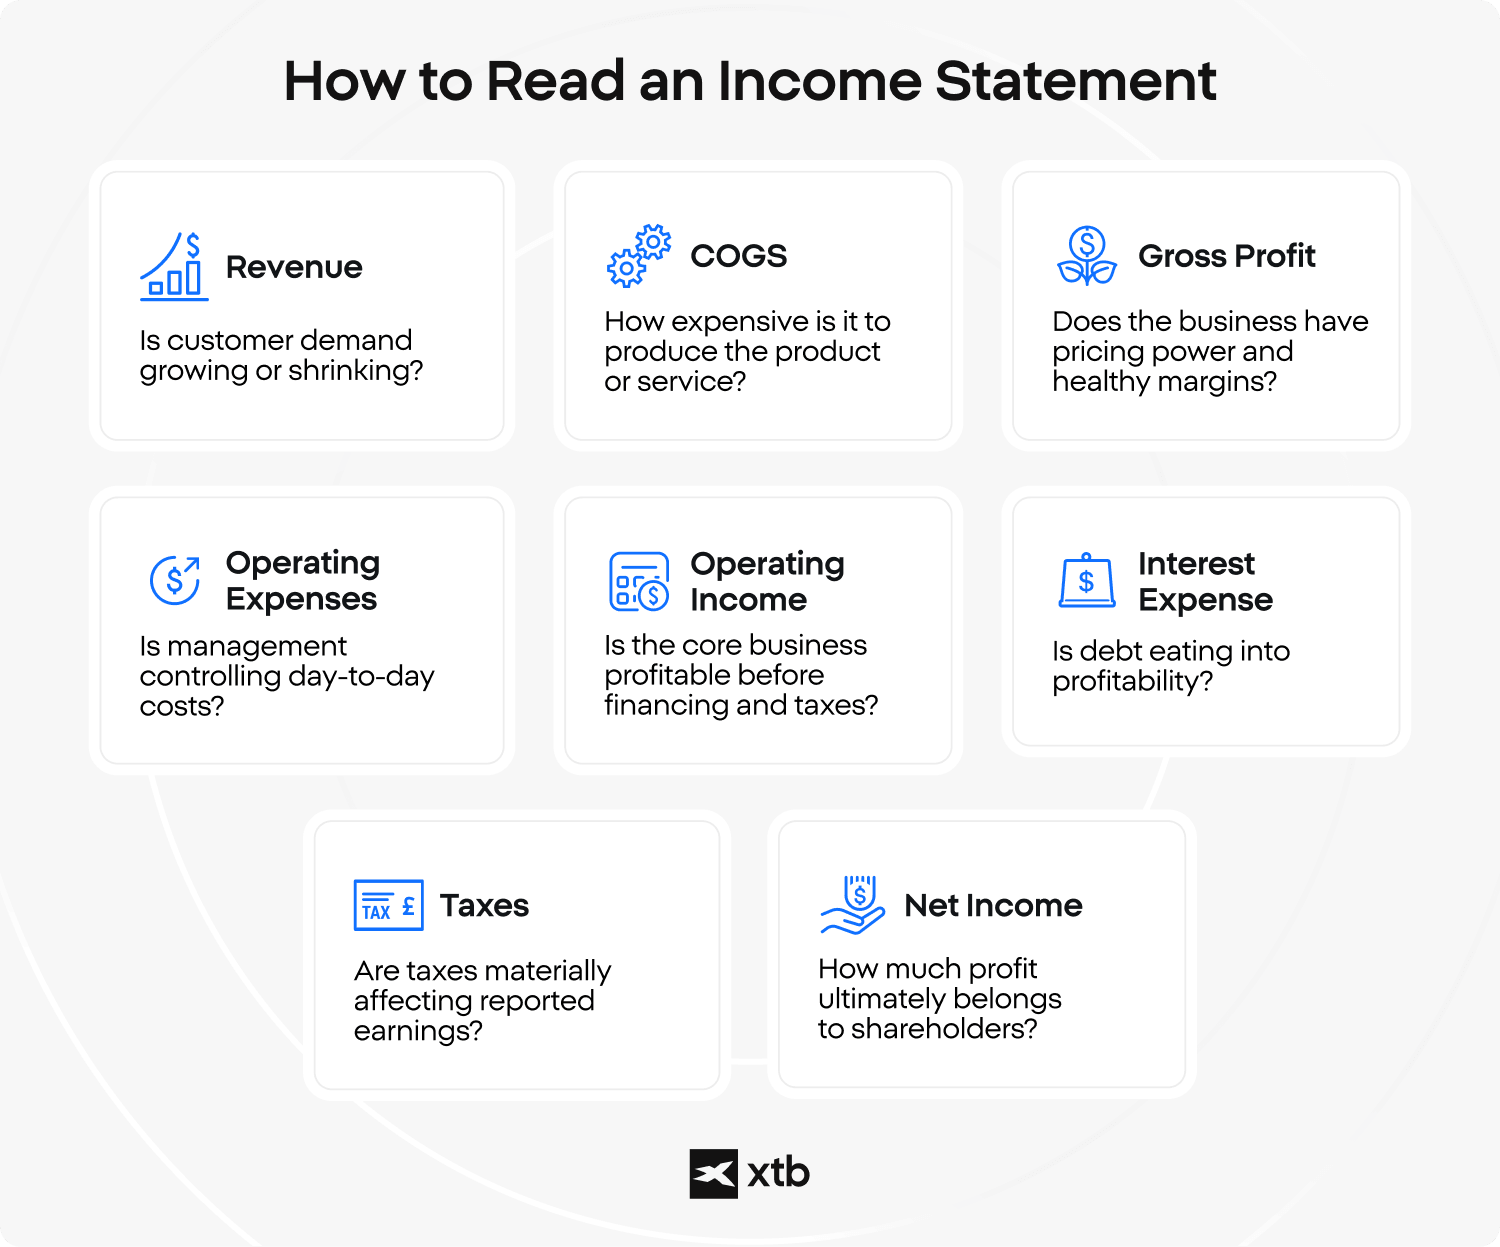
The key idea is that an income statement is not just a list of accounting figures. It tells the story of how a company turns sales into profit. Professional investors read it from the top down because every line answers a different question about the business.
- Revenue: Is customer demand growing or shrinking?
- Cost of goods sold (COGS): How expensive is it to produce the company's products or services?
- Gross profit: Does the business have pricing power and healthy gross margins?
- Operating expenses: Is management controlling day-to-day costs effectively?
- Operating income (EBIT): Is the core business profitable before financing costs and taxes?
- Interest expense: Is debt reducing the company's profitability?
- Taxes: Are taxes materially affecting reported earnings?
- Net income: How much profit ultimately belongs to shareholders?
Rather than viewing these numbers independently, investors analyze how one line influences the next. A company may report record revenue, but if operating expenses rise even faster, operating income and net income can still decline. Likewise, a temporary increase in interest costs or taxes may reduce net profit even when the underlying business remains healthy.
Looking at the report from top to bottom helps investors identify where a company's financial performance is improving or deteriorating. Revenue growth indicates stronger demand, expanding gross margins suggest improving pricing power or production efficiency, while rising operating expenses or interest costs may reveal challenges that are not immediately visible from headline earnings alone.
What is the income statement formula?
The core income statement formula is: Net Income = Total Revenue - Total Expenses
Intermediate steps calculate gross profit (Revenue - COGS) and operating income (Gross profit - operating expenses).
Applying the formula involves three distinct levels of calculation. First, the gross profit is determined by subtracting the cost of goods sold from the revenue. Second, the operating income is found by subtracting operating expenses from that gross profit.
The final step calculates overall profitability. To find the net income, you subtract all remaining financial obligations, including interest and taxes, from the operating income. This step-by-step subtraction ensures that every cost is accounted for before arriving at the final profit and loss statement (P&L) bottom line.
Income statement vs balance sheet vs cash flow: what's the difference?
The income statement tracks profitability over a specific period, the balance sheet records assets and liabilities at a single point in time, and the cash flow statement measures the actual movement of cash.
Understanding the difference between a balance sheet and an income statement is crucial for a complete financial view. These documents work together: the net income generated on the income statement flows directly into the balance sheet as retained earnings.
The distinct roles of each document can be summarised as follows:
|
|
|
|
|
|
|
|
|
|
|
|
|
|
|
|
Why does the income statement matter to investors?
For an investor, the income statement shows if a company is profitable, reveals revenue and margin trends over time, and supplies data for valuation metrics like earnings per share (EPS).
Analyzing the income statement allows investors to assess the true financial trajectory of a business. Instead of just looking at the stock price, evaluating the top-line revenue growth and the direction of the margins shows whether a company is fundamentally expanding or struggling with rising expenses.
The net income directly feeds into fundamental analysis. The bottom-line profit is used to calculate the earnings per share (EPS), which then drives the valuation ratios. By comparing these metrics across different companies, investors can make decisions based on hard data rather than market sentiment.
Where can you find a company’s income statement?
Publicly traded companies usually publish income statements in their annual and interim financial reports.
- In the United States, these are filed as annual (10-K) and quarterly (10-Q) reports with the SEC and are available through the SEC's EDGAR database and the company's Investor Relations website.
- In Europe and many other markets, companies typically publish annual reports and half-year or quarterly financial reports on their Investor Relations websites and through the relevant national stock exchange or financial regulator.
Many companies allow investors to subscribe to email alerts and receive new financial reports, including income statements, directly in their inbox.

FAQ
Yes. An income statement and a profit and loss statement (P&L) are different names for the same financial report. Some companies also refer to it as a statement of operations, but all describe a company's revenue, expenses, and profit or loss over a specific accounting period.
Revenue is the total amount of money a company earns from selling goods or services before any expenses are deducted. Net income is the final profit remaining after subtracting operating costs, interest, taxes, and all other expenses from revenue.
Yes. A company can generate strong sales while still reporting a net loss if its expenses exceed its revenue. Rising production costs, operating expenses, interest payments, or taxes can all reduce profitability despite growing revenue.
Net income is commonly called the "bottom line" because it appears at the bottom of the income statement after every source of revenue and every expense has been accounted for. It represents the company's final profit or loss for the reporting period.
An income statement always covers a specific period rather than a single date. Companies typically publish income statements quarterly and annually, allowing investors to compare financial performance over time.
No. The income statement measures revenue earned and expenses incurred under accounting rules, not actual cash movements. To analyse cash entering and leaving the business, investors use the cash flow statement.
Comparing several reporting periods helps investors identify trends in revenue growth, profit margins, operating expenses, and net income. Looking at a single quarter in isolation may not provide an accurate picture of a company's long-term financial performance.
An income statement allows investors to calculate several key profitability metrics, including gross margin, operating margin, and net profit margin. These ratios measure how efficiently a company converts revenue into profit at different stages of its operations.
Yes. Businesses generally prepare either a single-step or a multi-step income statement. The multi-step format separates operating and non-operating items, providing investors with a more detailed view of the company's core business performance.
The income statement helps investors evaluate a company's profitability, growth, and operational efficiency. It also provides key inputs for valuation metrics such as earnings per share (EPS), making it one of the most important financial statements used in fundamental analysis.