
The reader wants to know which technology companies are the biggest, how that is measured, and what "Big Tech" means - leaving able to distinguish size rankings from market dominance.
The reader wants to know which technology companies are the biggest, how that is measured, and what "Big Tech" means - leaving able to distinguish size rankings from market dominance.


The biggest tech companies are primarily ranked by their market capitalization, with the current leaders being NVIDIA, Alphabet, and Apple. The combined market capitalization of these top-tier tech giants exceeds $14 trillion. Understanding how these rankings are calculated using metrics like market cap versus revenue is crucial for evaluating the technology sector, while exploring the concept of Big Tech helps identify why a few dominant firms hold so much influence.
- The 7 top Big Tech leaders currently are Nvidia, Apple, Alphabet, Microsoft, Amazon and SpaceX.
- After the successful SpaceX stock market debut, the company is valued higher than Meta Platforms
- "Big Tech" refers to a concept of market dominance and influence, not just the financial size of a technology company.
- Market cap and revenue are two distinct metrics that produce entirely different ranking lists.
- You can gain exposure to these giants through individual stocks, ETFs, or index funds, though concentration risks apply.
What are the biggest tech companies right now?
The biggest tech companies are primarily ranked by market capitalization, and as of August 2026, the current leaders include NVIDIA, Apple, Alphabet and Microsoft. This ranking reflects the collective value placed on these firms by investors. According to Bloomberg data and SEC 10-K filings, the top list provides a snapshot of the most valuable tech players globally.
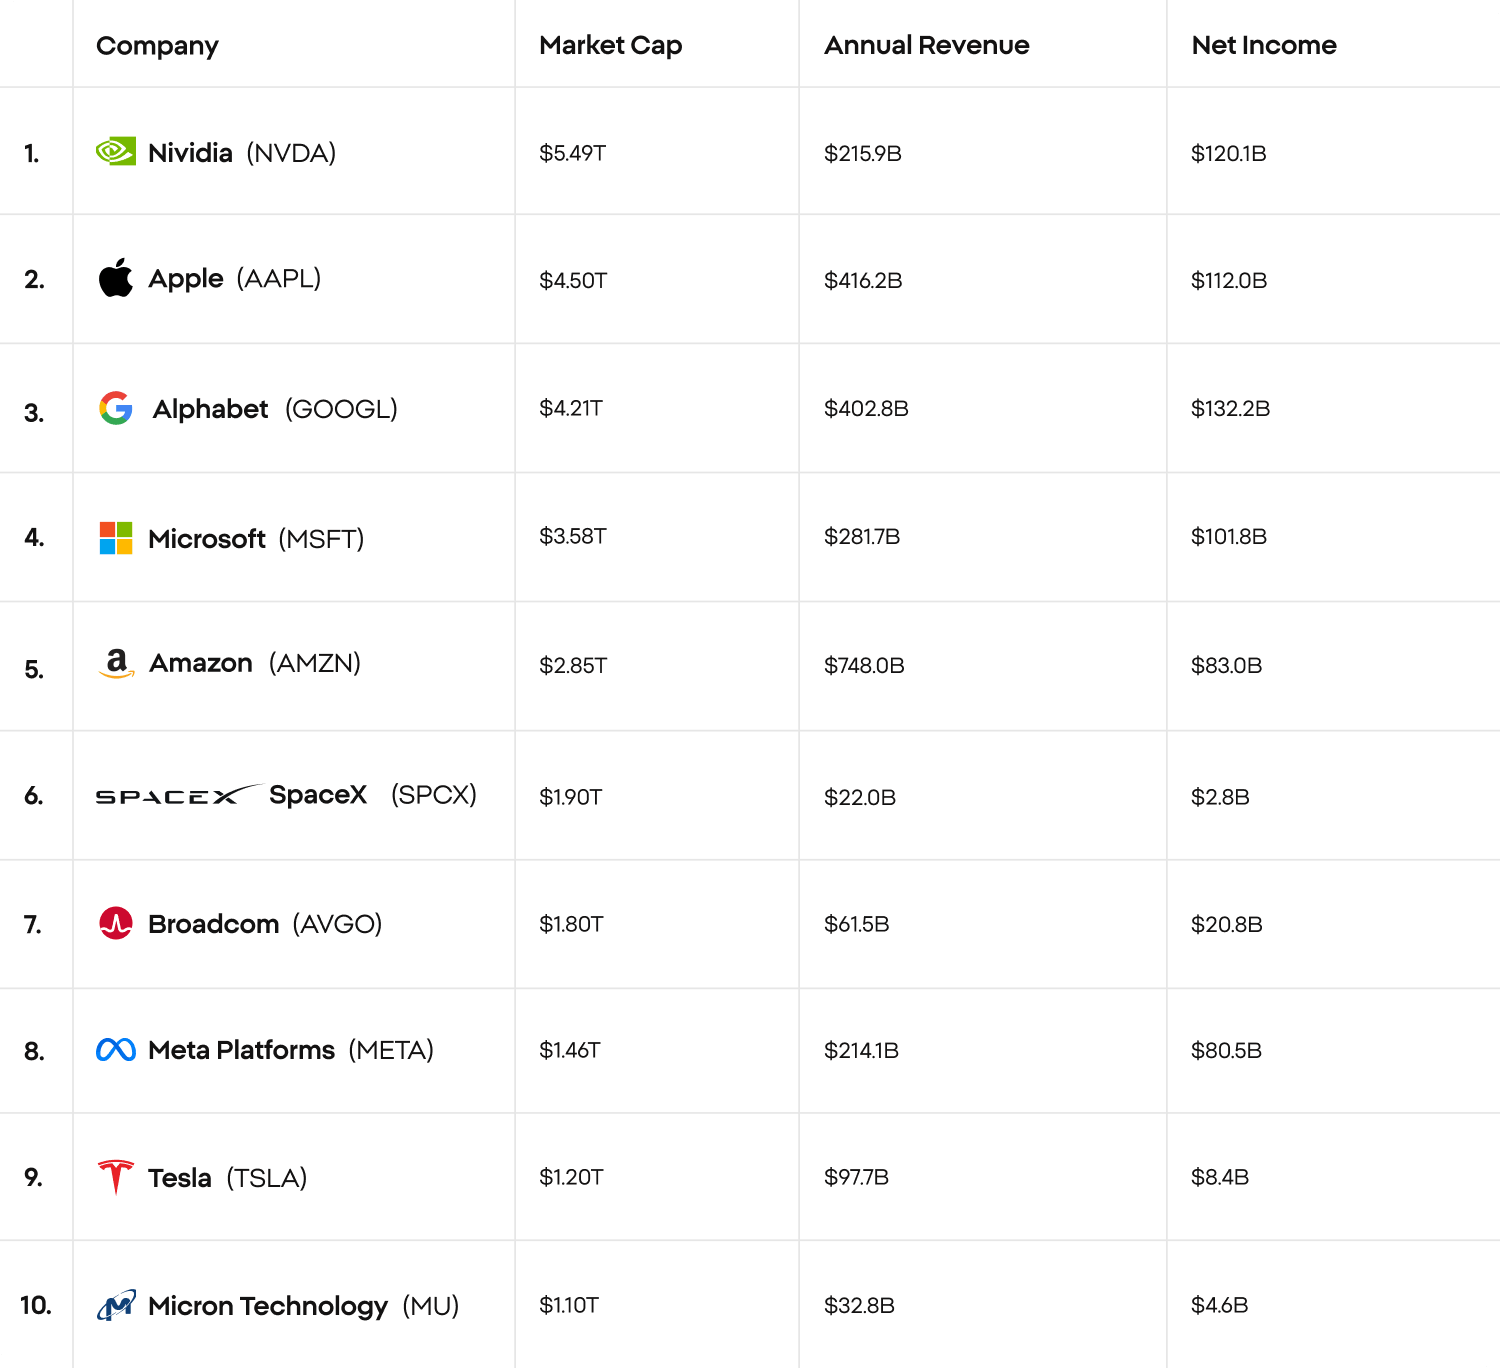
Here is the current top list of the biggest tech companies by market capitalization, representing the core of the "Magnificent 7" and the broader "10 biggest", as of August 2026:
- NVIDIA (NVDA) – Market Cap: $5.49 trillion
- Apple (AAPL) – Market Cap: $4.50 trillion
- Alphabet (GOOGL) – Market Cap: $4.21 trillion
- Microsoft (MSFT) – Market Cap: $3.58 trillion
- Amazon (AMZN) – Market Cap: $2.85 trillion
- SpaceX (SPCX) – Market Cap: $1.90 trillion
- Broadcom (META) – Market Cap: $1.80 trillion
- Meta Platforms (TSLA) – Market Cap: $1.46 trillion
- Tesla (TSLA) – Market Cap: $1.20 trillion
- Micron (MU) – Market Cap: $1.1 trillion
NVIDIA
NVIDIA designs graphics processing units and holds a dominant position in the artificial intelligence chip market. It currently leads the sector with a market capitalization of $5.5 trillion as of August 2026.
Its business is increasingly driven by data-center infrastructure, where GPUs such as Blackwell are used to train and run large AI models. Beyond hardware, NVIDIA has built a powerful software ecosystem around CUDA, networking solutions, and complete computing systems, which strengthens customer retention.
For investors, key factors include the pace of global AI infrastructure spending, demand from hyperscale cloud providers, supply availability, and the company’s ability to maintain high margins. Important risks include growing competition from custom AI accelerators, export restrictions, customer concentration, and the possibility that AI capital expenditure eventually slows from current elevated levels.
Past performance is not a reliable indicator of future results.
Apple
Apple is a global leader in consumer electronics, software, and services. The company maintains its elite status among the biggest tech companies with a market capitalization of $4.5 trillion.
The iPhone remains the core of Apple’s ecosystem, but the company has steadily expanded recurring revenue from services such as the App Store, iCloud, Apple Music, and other subscriptions. Its enormous installed device base gives Apple significant pricing power and creates opportunities to monetize customers across multiple products.
Investors typically monitor iPhone replacement cycles, Services growth, gross margins, China exposure, and capital returns through buybacks and dividends. Apple’s balance sheet and strong free cash flow provide financial flexibility, although its size makes sustained high growth more difficult. Regulatory pressure on the App Store and increasing competition in premium smartphones are also important long-term considerations.
Past performance is not a reliable indicator of future results.
Alphabet (Google)
Alphabet, the parent company of Google, controls the majority of the global search engine market. Its market capitalization stands at $4.21 trillion.
Advertising remains the company’s economic engine, particularly through Google Search and YouTube, but Google Cloud and AI are becoming increasingly important contributors to growth. Alphabet also owns Android, Chrome, Maps, and a portfolio of experimental businesses including Waymo. Its scale provides enormous amounts of data, distribution, and cash flow that can be reinvested into artificial intelligence infrastructure.
Investors should pay particular attention to Search monetization, Google Cloud profitability, capital expenditure, and the impact of generative AI on traditional search behavior. Key risks include antitrust regulation, competition from AI assistants, rising infrastructure costs, and the possibility that new search formats change the economics of digital advertising.
Past performance is not a reliable indicator of future results.
Microsoft
Microsoft dominates enterprise software and cloud computing. It secures its spot at the top with a market capitalization of $3.58 trillion.
The company combines highly recurring software revenue with one of the world’s largest cloud platforms, Azure. Microsoft 365, Windows, Dynamics, GitHub, cybersecurity products, and its growing AI portfolio make the business unusually diversified within the technology sector. A major investment theme is the monetization of artificial intelligence through Azure infrastructure and Copilot products across enterprise workflows.
Investors should follow cloud revenue growth, AI-related capital expenditure, operating margins, and the pace at which new AI services generate incremental revenue. Microsoft benefits from deep enterprise relationships and high switching costs, although heavy spending on data centers and rising competition from Amazon, Google, and specialized AI providers could affect future returns on invested capital.
Past performance is not a reliable indicator of future results.
Amazon
Amazon is a powerhouse in both e-commerce and cloud infrastructure. The company currently has a market capitalization of $2.85 trillion.
Its business model is broader than online retail alone. Amazon Web Services is a major source of operating profit, while advertising has developed into another high-margin growth engine. The company also operates Prime, logistics infrastructure, digital media, and an expanding portfolio of AI and semiconductor initiatives.
For investors, the key question is often not simply how fast revenue grows, but how effectively Amazon converts its enormous scale into higher operating margins and free cash flow. AWS growth, retail efficiency, advertising revenue, capital expenditure, and fulfillment costs are particularly important metrics. Risks include intense cloud competition, very high investment requirements, regulatory scrutiny, and the inherently low-margin nature of large parts of the retail business.
Past performance is not a reliable indicator of future results.
SpaceX
SpaceX is a leading aerospace and space infrastructure company focused on launch services, satellite communications, and reusable rocket technology. Although it is a private company, secondary market funding rounds as of mid-August 2026 give it an estimated valuation of $1.9 trillion.
Its business is built around several major platforms, including Falcon 9, Starship, and Starlink. Starlink gives SpaceX a recurring-revenue component through satellite internet services, while launch operations provide exposure to commercial, government, and defense demand.
Starship could materially expand the company’s addressable market if it lowers launch costs and supports larger payloads, lunar missions, and eventually deeper-space projects. Investors should watch launch cadence, Starlink subscriber growth, capital expenditure, regulatory approvals, and progress toward fully reusable heavy-lift systems. Key risks include high development costs, technical setbacks, launch failures, government dependence, regulatory constraints, and the capital intensity of building and maintaining large-scale space infrastructure.
Past performance is not a reliable indicator of future results.
Broadcom
Broadcom is a global technology company combining a large semiconductor business with infrastructure software. Its portfolio spans networking chips, connectivity solutions, custom AI accelerators and enterprise software, making the company an important supplier to data centers, telecommunications networks and large corporate customers. Its market capitalization stands at approximately $1.8 trillion.
The company has gained additional exposure to artificial intelligence through high-speed networking and custom semiconductor solutions used by hyperscale cloud providers, while the VMware acquisition substantially expanded its infrastructure software operations.
Broadcom describes its business as a combination of semiconductor and infrastructure software platforms, with a relatively concentrated customer base: its five largest end customers represented roughly 40% of fiscal 2025 revenue. For investors, key areas to monitor include AI semiconductor demand, VMware integration, software margins, free cash flow and customer concentration. Major risks include high valuation, acquisition execution, cyclical chip demand and dependence on several large customers.
Past performance is not a reliable indicator of future results.
Meta
Meta owns the largest social media platforms globally, including Facebook and Instagram. The firm's market capitalization is $1.46 trillion.
Advertising across Facebook and Instagram remains the company’s primary profit engine, supported by billions of users and sophisticated recommendation systems. WhatsApp also offers significant long-term monetization potential, while Meta is investing heavily in artificial intelligence, data-center infrastructure, and Reality Labs.
Investors should watch advertising pricing, user engagement, operating expenses, capital expenditure, and the return generated from AI investments. Meta’s ability to use AI to improve content recommendations and advertising efficiency could support revenue growth and margins. At the same time, substantial spending on infrastructure and virtual-reality projects creates execution risk. Regulatory pressure, privacy rules, competition for user attention, and dependence on digital advertising remain important considerations.
Past performance is not a reliable indicator of future results.
Tesla
[WIDGET: price chart - TSLA]
Often grouped with tech giants due to its software and electric vehicle technology, Tesla boasts a market capitalization of $1.2 trillion.
Tesla’s investment case increasingly extends beyond vehicle sales. The company is developing energy storage, autonomous-driving software, robotaxi technology, artificial intelligence infrastructure, and the Optimus humanoid robot. This gives Tesla exposure to several potentially large markets, but it also makes valuation highly dependent on expectations about businesses that are still developing.
Investors should monitor vehicle deliveries, automotive gross margins, pricing, energy-storage growth, free cash flow, and progress in autonomous driving. Competition in electric vehicles has intensified globally, particularly from Chinese manufacturers, while price reductions can pressure profitability. Tesla therefore combines significant technological optionality with unusually high execution, regulatory, competitive, and valuation risk.
Past performance is not a reliable indicator of future results.
Micron Technology
[WIDGET: price chart - MU]
Micron Technology is one of the world’s largest manufacturers of memory and storage semiconductors, with a portfolio centered on DRAM, NAND flash, high-bandwidth memory and data-center SSDs. Its market capitalization stands at approximately $1.1 trillion.
The company has become increasingly important to the AI infrastructure market because advanced accelerators require large amounts of high-performance memory, particularly HBM. Micron also supplies memory for cloud servers, PCs, smartphones, automotive systems and industrial applications. In fiscal 2025, DRAM generated $28.58 billion of revenue, while Micron significantly expanded its cloud-memory business as demand for AI infrastructure accelerated.
For investors, important factors include HBM demand, memory pricing, manufacturing yields, capital expenditure and data-center growth. Key risks include the semiconductor cycle, pricing volatility, heavy investment requirements, competition and customer concentration.
Past performance is not a reliable indicator of future results.
How are the biggest tech companies measured - market cap or revenue?
Rankings depend entirely on the chosen metric: using market capitalization generates a completely different list compared to using annual revenue, which explains why various financial platforms show contrasting hierarchies. Market cap represents the total value of a company's outstanding shares—calculated by multiplying the share price by the number of shares—and fluctuates daily based on market sentiment.
In contrast, revenue measures the total income a company generates over a fiscal year, offering a more stable but less forward-looking metric. For example, lists compiled by the Fortune Global 500 base their rankings on revenue, which can elevate high-volume hardware manufacturers above high-margin software firms. This creates a discrepancy between size by sales and size by investor valuation.
Defining what constitutes a "technology company" also shifts the results. A pure software developer, a semiconductor manufacturer, and an e-commerce platform all operate within the technology sector, but their business models scale differently.
What does "Big Tech" mean, and which companies are included?
"Big Tech" is a concept referring to the most dominant and influential technology companies—not just the largest by physical size—and traditionally includes the "Big Five": Alphabet, Amazon, Apple, Meta, and Microsoft. This distinction is crucial for investors. While market capitalization measures financial size, "Big Tech" status reflects market dominance, user reach, and control over global data ecosystems.
Over time, the groupings of these influential firms have evolved. Investors often refer to the "Magnificent Seven”, which adds NVIDIA and Tesla to the core group of tech giants. Sometimes, analysts refer to the "big 6 in tech," typically meaning the Big Five plus NVIDIA due to its massive growth.
Why are these tech companies so dominant?
The dominance of the biggest tech companies stems from powerful network effects, expansive platform ecosystems, data advantages, and massive scale that create severe barriers to entry for competitors. These structural advantages allow Big Tech to maintain their leadership and fund continuous research and development. Understanding how to invest in stocks within this sector requires recognizing the implications of this immense scale.
A key example of this scale is the market capitalization trajectory of NVIDIA from 2023 to 2026, driven aggressively by the boom in artificial intelligence. While impressive, it is essential to remember that past performance does not guarantee future results.
Furthermore, their vast market share frequently attracts scrutiny from EU and US antitrust regulators, who investigate anti-competitive practices and market concentration.

FAQ
FAQ
The largest technology company is the one with the highest total value of publicly traded shares at a given moment. In the ranking used in this article, NVIDIA holds the top position, reflecting the market’s strong expectations for artificial intelligence, data-center infrastructure and accelerated computing.
That position is not permanent. Market capitalization moves with the share price, so the ranking can change even when no new annual financial results have been published. This is why any list of the world’s largest companies should always be read together with its valuation date.
The largest technology-related companies currently include NVIDIA, Apple, Alphabet, Microsoft, Amazon and Meta, while Tesla and SpaceX add exposure to areas such as electric vehicles, autonomy, aerospace and satellite communications.
A market-cap ranking tells you which companies the stock market values most highly, but it does not tell you which company has the highest revenue, strongest margins or fastest growth.
Market capitalization and revenue measure two completely different things. Market cap represents the total equity value investors assign to a company, while revenue shows how much money the business generates from selling products and services during a reporting period.
That is why a highly profitable semiconductor or software company can be worth more on the stock market than a retailer or industrial company with much higher annual sales. Market cap is influenced by future expectations, while revenue mainly describes the current scale of the business.
The main differences are:
Market capitalization: share price multiplied by shares outstanding.
Revenue: total sales generated during a fiscal period.
Net income: profit remaining after costs, interest and taxes.
Free cash flow: cash generated after operating and investment spending.
The largest technology companies often combine several qualities that markets value highly: global scale, recurring revenue, strong brands, proprietary technology, large customer ecosystems and high operating leverage. Once these businesses reach sufficient scale, they can often distribute software, advertising or digital services to additional users at relatively low incremental cost.
Artificial intelligence has added another layer to that story. Semiconductor companies, cloud providers and digital platforms increasingly sit at different points of the AI value chain, from computing infrastructure to software distribution. However, high valuations also mean investors may already be paying for years of expected growth, making execution increasingly important.
“Big Tech” is an informal term used to describe a small group of exceptionally powerful and influential technology companies. It traditionally refers to Alphabet, Amazon, Apple, Meta and Microsoft because of their global platforms, large user bases and control over major areas such as search, cloud computing, mobile ecosystems, social media and e-commerce.
The definition has become less precise over time. NVIDIA is now frequently discussed alongside traditional Big Tech because of its role in AI infrastructure, while Tesla is often included in broader technology-focused investor groupings because of its exposure to software, autonomy, robotics and artificial intelligence.
The phrase became popular because these companies grew into some of the most influential stocks in major US equity indexes and were responsible for a significant share of market performance during the recent technology and AI cycle.
What makes the group interesting is that these are not seven versions of the same business. NVIDIA sells computing infrastructure, Apple builds a consumer ecosystem, Microsoft and Amazon have major cloud businesses, Alphabet and Meta depend heavily on advertising, and Tesla combines vehicles with energy, software and autonomy.
For a quick comparison:
NVIDIA: AI chips and accelerated computing
Microsoft and Amazon: cloud infrastructure and enterprise technology
Alphabet and Meta: advertising, platforms and AI
Apple and Tesla: hardware ecosystems with growing software exposure
NVIDIA’s rise is closely tied to the rapid growth of artificial intelligence infrastructure. Its GPUs are widely used to train and run advanced AI models, but the company’s competitive position extends well beyond individual chips. CUDA software, networking technology and complete data-center systems have created an ecosystem that is difficult for customers to replace quickly.
For investors, the important question is whether AI infrastructure spending can remain strong enough to support current expectations. NVIDIA’s growth potential is significant, but so are the risks from custom accelerators, competing chip architectures, export restrictions and the possibility that hyperscale customers eventually moderate capital expenditure.
No. A company can have an enormous market capitalization without being the company with the highest current profit. Market value reflects what investors expect the business to earn in the future as well as how durable they believe its competitive advantages will be.
This is particularly important when comparing companies from different industries. A bank, semiconductor manufacturer, advertising platform and e-commerce business operate with very different margins, capital requirements and balance sheets. Looking only at market cap can therefore hide meaningful differences in business quality and financial performance.
Market-cap rankings change because share prices change. Earnings reports, interest rates, product launches, regulation, macroeconomic conditions and shifts in investor sentiment can move the value of a company by hundreds of billions of dollars in a relatively short period.
This is also why investors should be cautious with screenshots or rankings that do not show a date. A list that was accurate several months ago may already be outdated even though the companies themselves have not changed substantially.
Before using a ranking, it is worth checking:
the exact valuation date,
whether market cap is measured in the same currency,
whether the figures refer to the full company or a specific share class,
and whether the financial figures are annual, trailing twelve months or estimates.
No. A larger market capitalization simply means the stock market assigns a higher total value to the company’s equity. It says nothing by itself about whether the shares are attractively priced.
A strong business can still be a difficult investment if expectations are already extremely high. Conversely, a smaller company is not automatically more attractive simply because its valuation is lower. Investors need to compare price with earnings, cash flow, growth, competitive position and risk rather than using market cap as a quality score.
The most useful comparison starts with understanding how each company actually makes money. NVIDIA depends heavily on AI infrastructure demand, Apple on devices and services, Alphabet and Meta on advertising, Amazon on retail and AWS, while JPMorgan Chase depends on lending, fees and capital-market activity.
From there, investors can compare revenue growth, profit margins, free cash flow, capital expenditure, balance-sheet strength and valuation. It is also important to ask how much of the current share price depends on future growth that has not yet been delivered. That question often matters more than the headline size of the company.
The largest companies can look safer because of their scale, strong balance sheets and established products, but size does not remove investment risk. High valuations can make these stocks sensitive to slower growth, weaker margins or lower-than-expected returns on major investments such as AI infrastructure.
There is also portfolio concentration risk. A relatively small group of mega-cap companies can represent a large portion of major stock indexes, meaning an investor may already have substantial exposure to them through an ETF or index fund. The article also highlights regulatory pressure and antitrust scrutiny as important long-term considerations.