
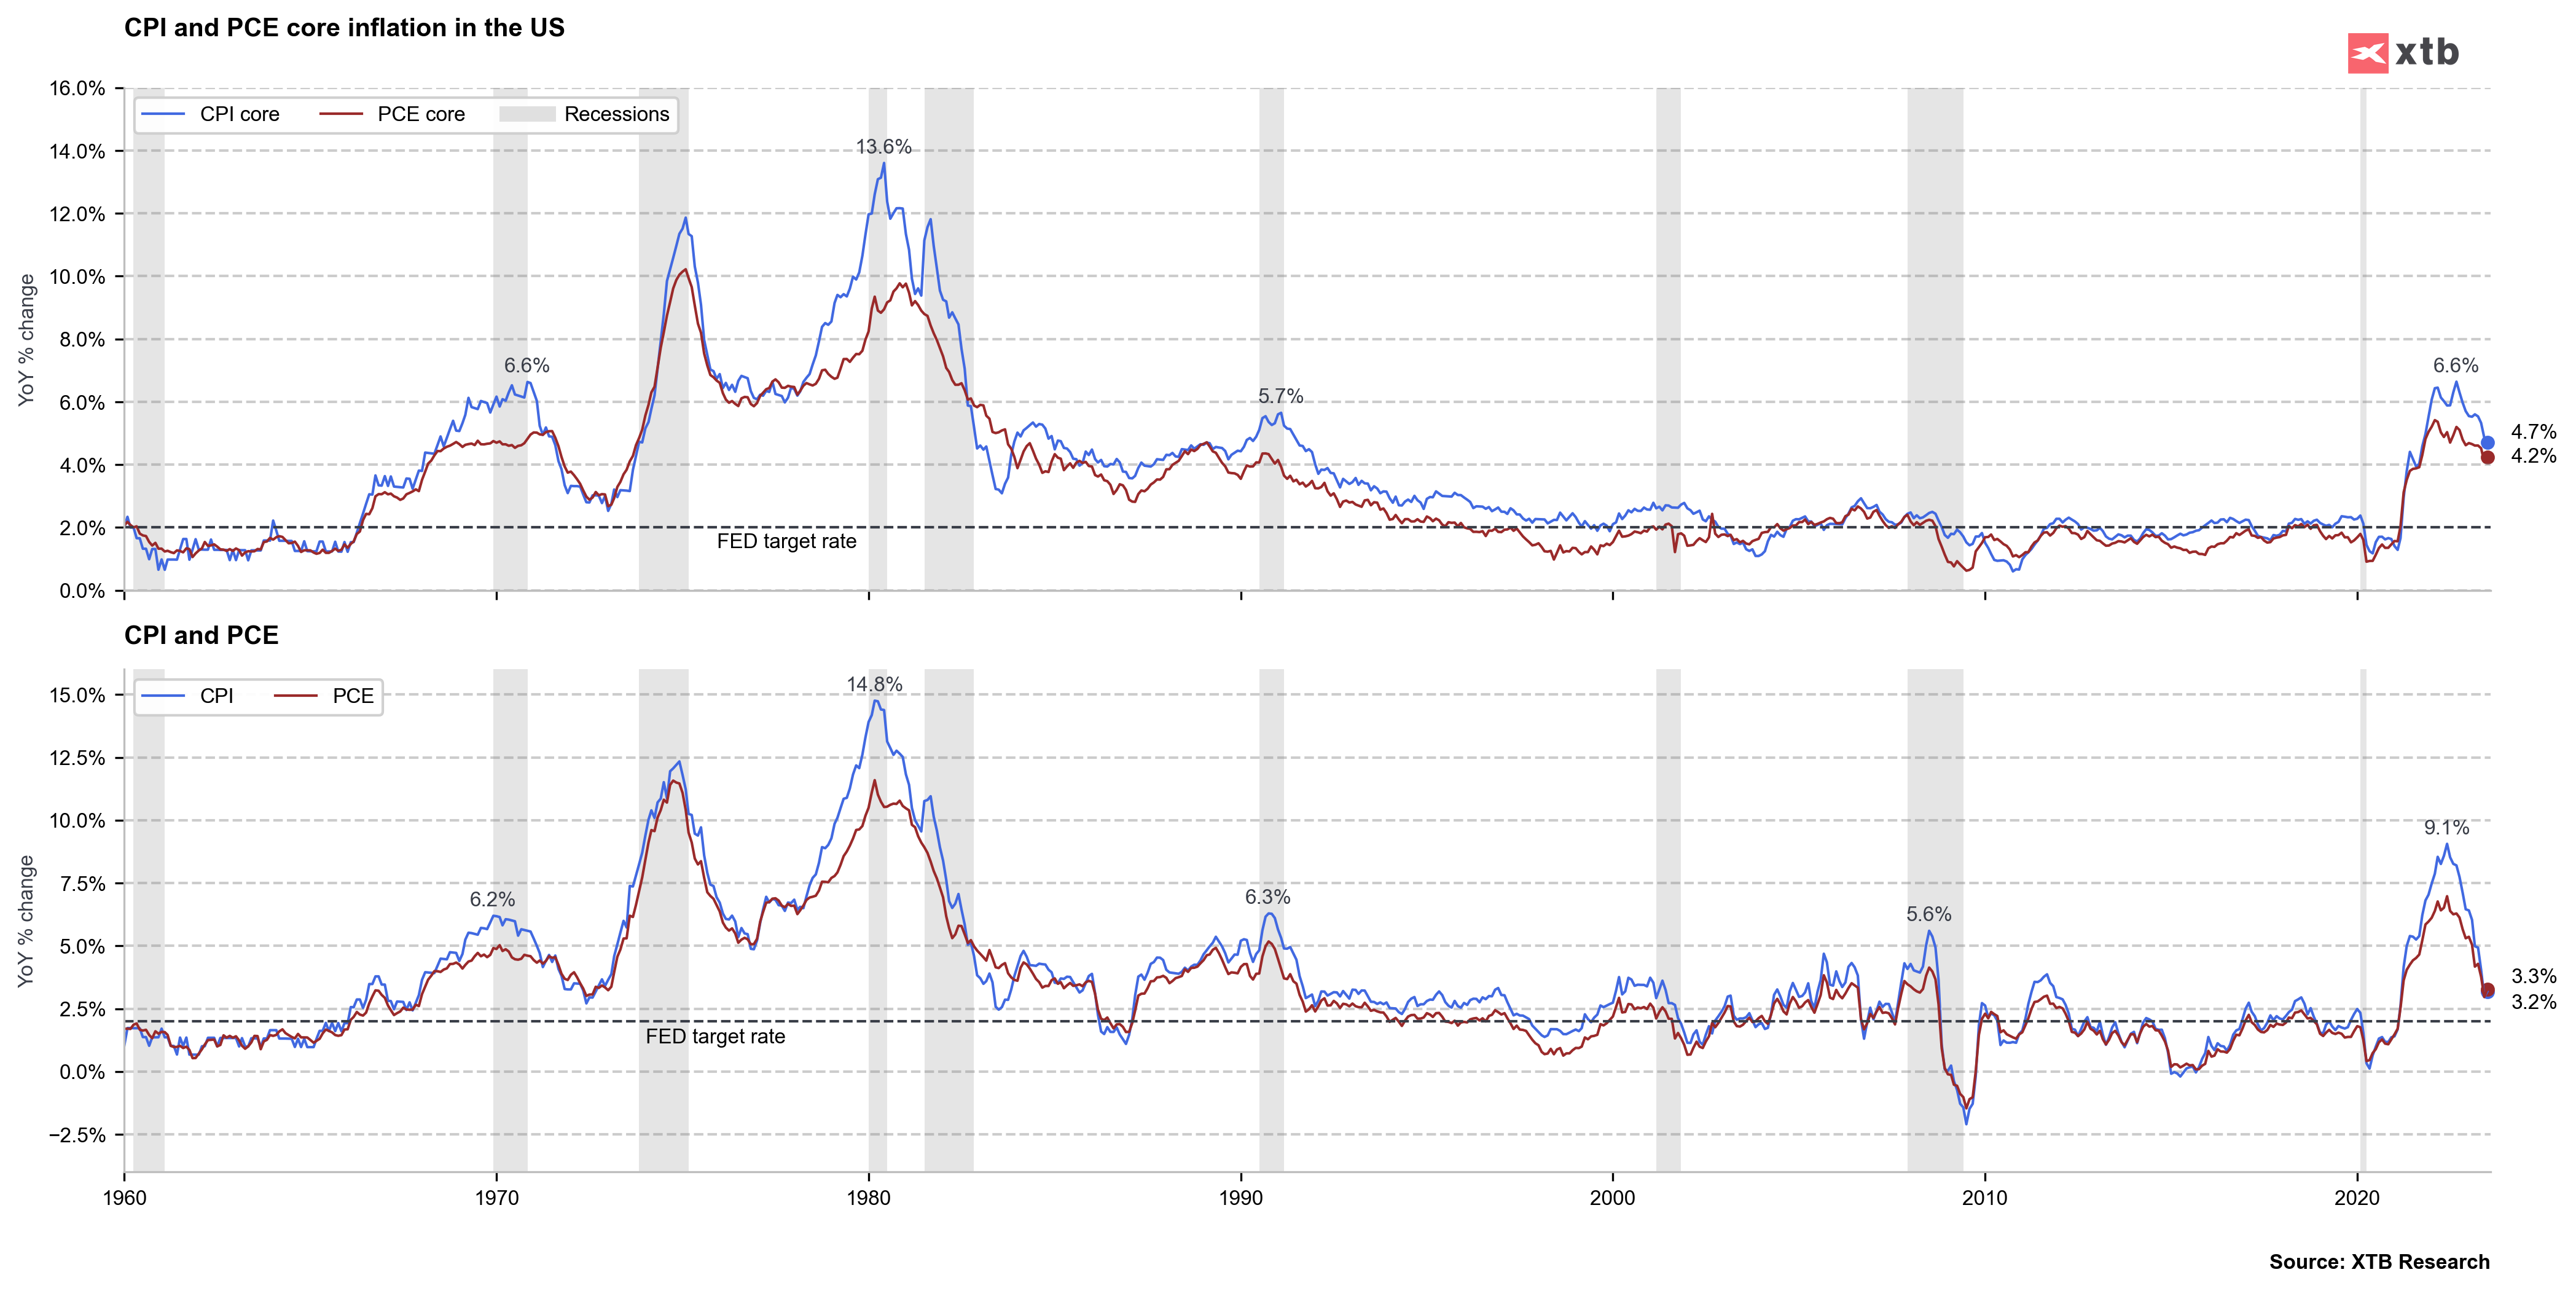
US Core PCE Price index y/y: 4,2% exp. 4,2% vs 4,1% previously
US PCE Price index: 3,3% exp. 3,3% vs 3% previously
US PCE Price index m/m: 0,2% exp. 0,2% vs 0,2 previously
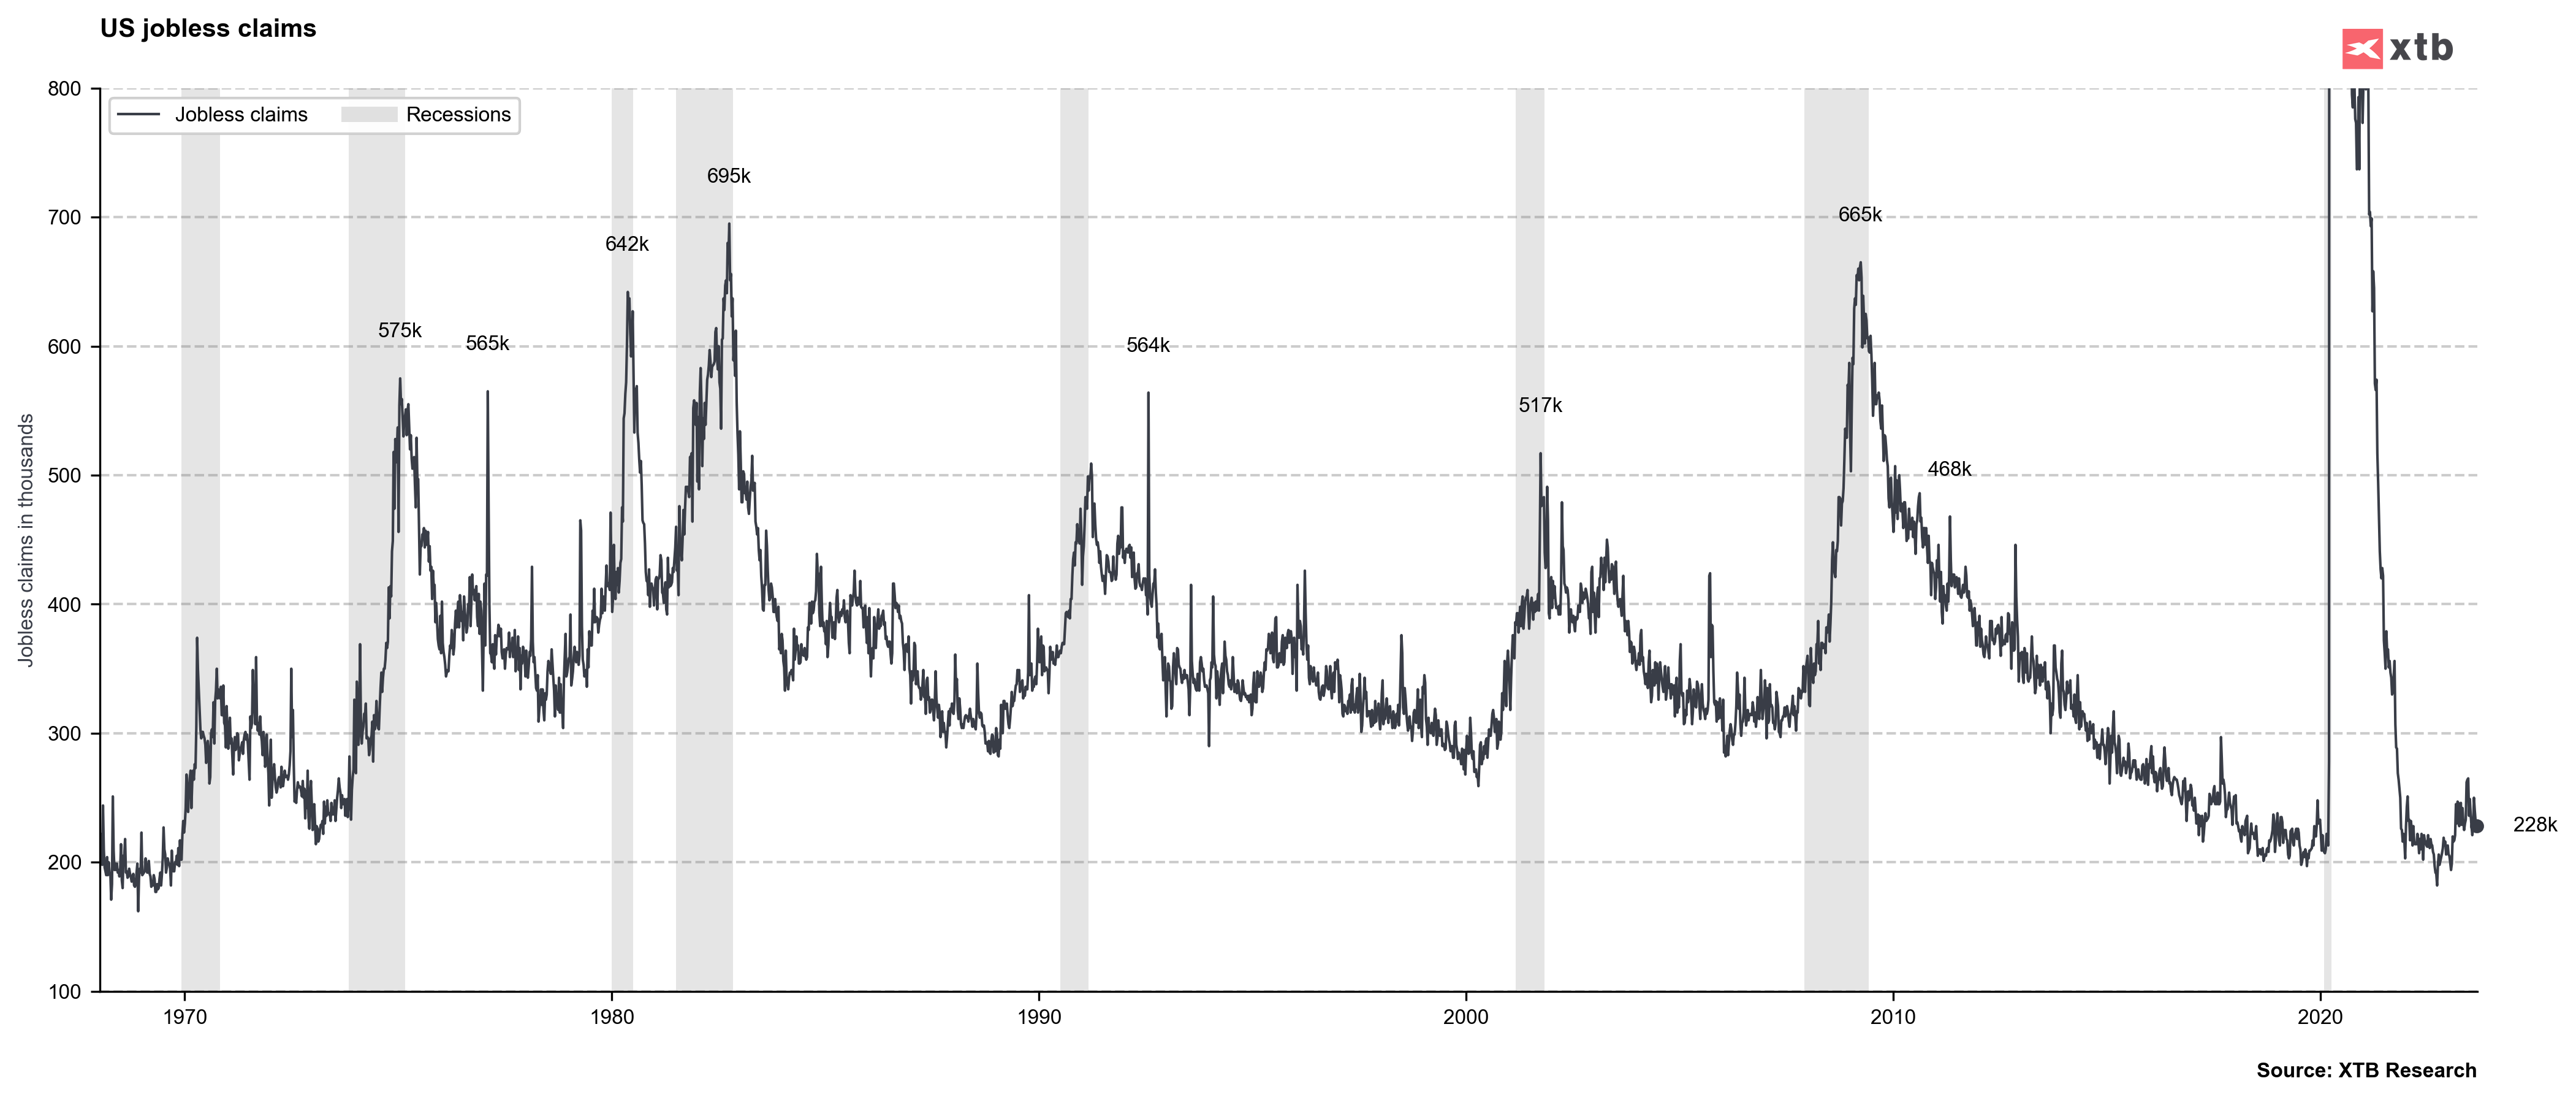
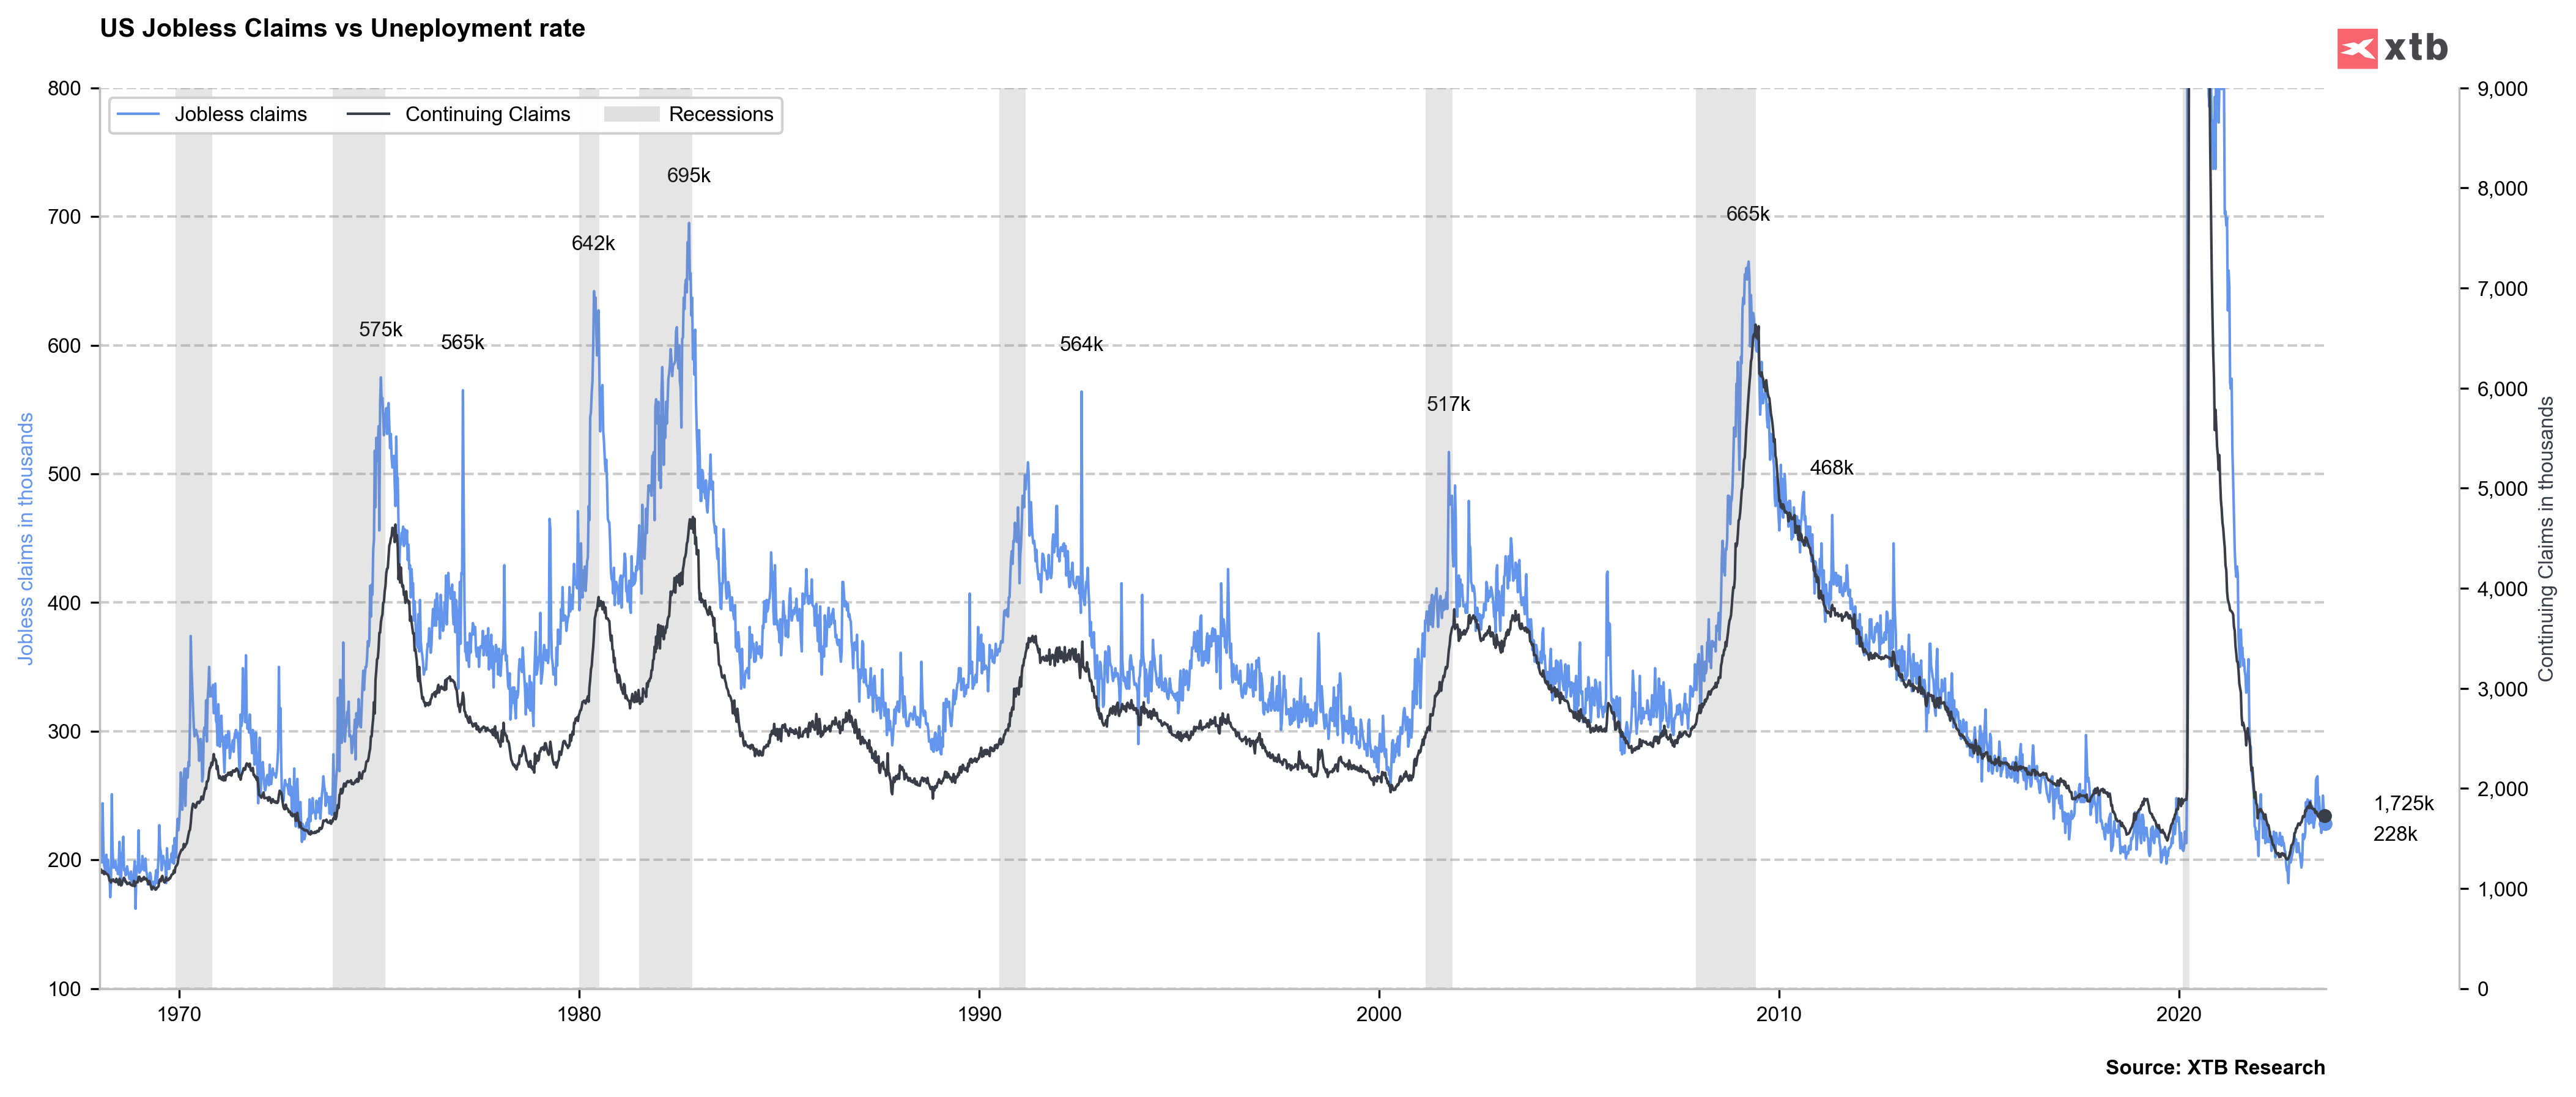
US Initial jobless claims: 228k exp. 235 k vs 230 k previously
US Continued jobless claims: 1,725 mln exp. 1,706 mln vs 1,702 mln previously
US Personal income m/m: 0,2% exp. 0,3% vs 0,3% previously
US Personal consumer spending m/m: 0,8% exp. 0,7% vs 0,5% previously
US Real Personal Consumption m/m: 0,6% exp. 0,5% vs 0,4% previously
In first reaction after new US data US500 falls down slightly but reading was quite good for the stock market. Lower claims signalize that job market is still strong and important for Fed PCE data came in line with Wall Street expectations (July PCE inflation was higher than in June due to underlying y/y factors). At the same time real US personal consumption is slighlty higer than expected and faster than before (0,6% vs 0,4% previously). It's worth noting that Challenger report (layoffs) today came in 75,151 reading vs 23,697 expected. Tomorrow's US Non-farm payrolls (NFP) report will be the most important reading this week.
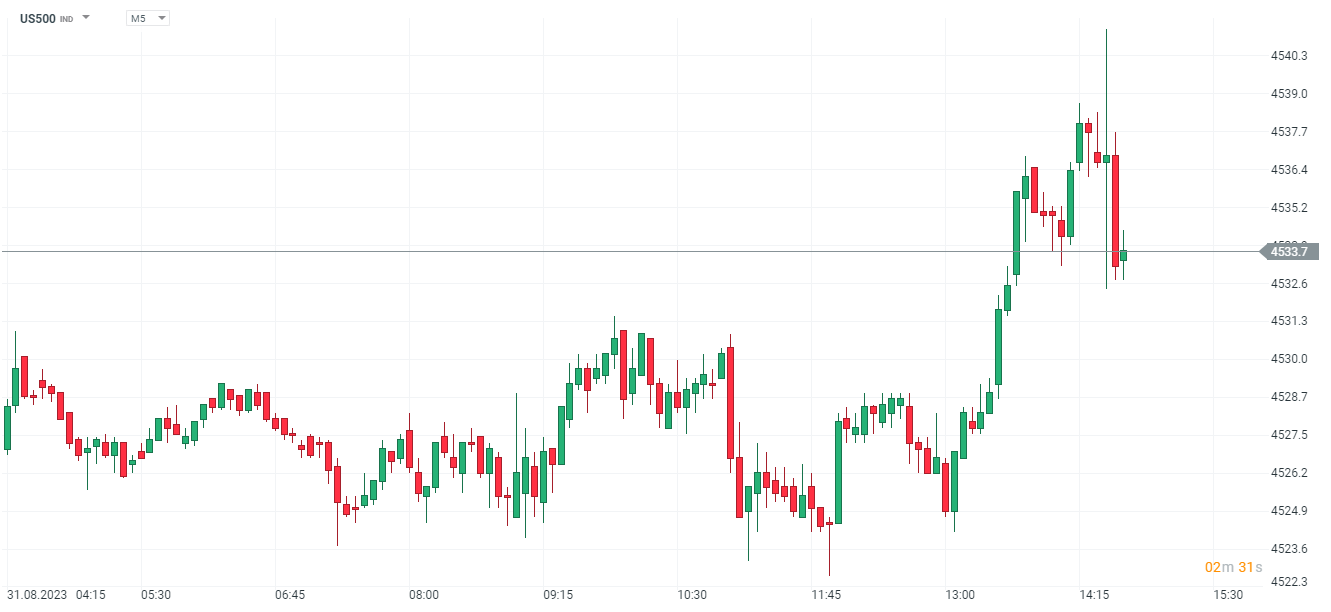 Source: xStation5
 Source: XTB Research
 Source: XTB Research
 Source: XTB Research

Economic calendar - Europe's Inflation and US Housing Market in Spotlight

Economic Calendar: Earnings, US Retail Sales and Fed to Fight for Investors' Attention (16.07.2026)

BREAKING: GBPUSD up 0.1% after better-than-expected UK GDP data 🇬🇧 📈

Daily Summary: Wall Street Gains, Dow Jones Near All-Time Highs After Softer PPI Data