



3:30 pm BST - EIA report on US oil inventories
- Oil inventories. Actual: -0,451 mb. Expected: 1.5 mb (API: -1.71 mb)
- Gasoline inventories. Actual: 2.746 mb. Expected: 1.6 mb (API: +2.42 mb)
- Distillate inventories. Actual: 5,074 mb. Expected: 2.1 mb (API: +4.50 mb)
- Refinery Utilization: +2.70% (Expected: +0.50%; Prev +1.40%)
Refineries ran hard last week in an attempt to build product inventories ahead of driving season. US refinery activity hits 95,8% of capacity, highest since August 19th, 2019.
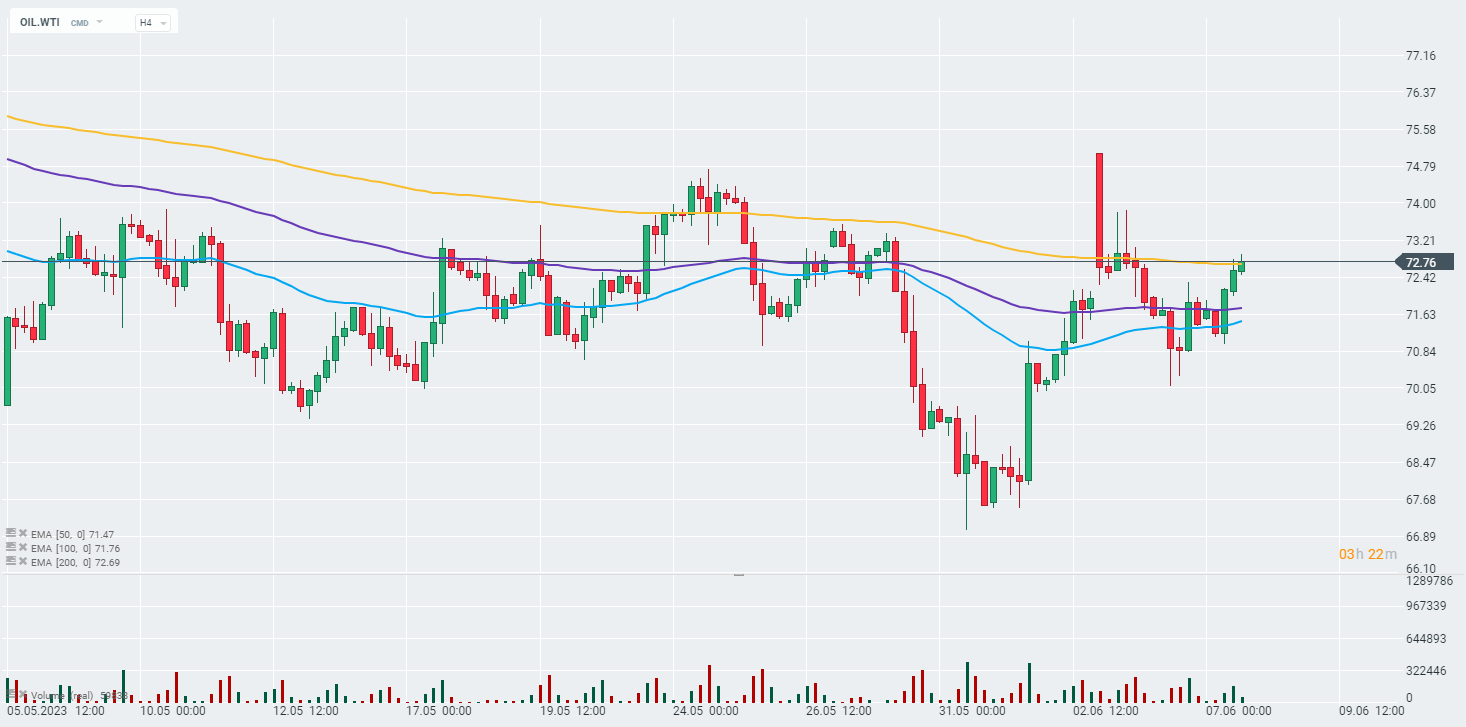 Source: xStation 5


Nickel market panic 🚩 INSG revises forecast, surplus in 2027?



Market Wrap: Tech Sell-Off Hits Europe, Gold Shines Again


Gold sell-off over? 🔼 Central banks buy the most in nearly two years


🚨Morning Wrap: A weaker dollar, strong gold, and a tech sector in free fall—what’s driving the market❓