A pack of inflation data from the United Kingdom was released this morning at 7:00 am BST. Headline CPI inflation accelerated from 7.0% to 9.0% YoY in April. Monthly increase in prices amounted to 2.5% MoM. While both YoY and MoM readings look very high, it should be noted that in both cases data missed marked expectations. Core CPI accelerated from 5.7 to 6.2% YoY - in-line with market expectations. Situation looked different in case of producers' inflation - PPI inflation accelerated from 11.9 to 14.0% YoY and was much higher than 12.5% YoY expected. Such high inflation readings only reinforce the outlook that the Bank of England will need to keep rising rates, what is likely to push the UK economy into recession. This is a narrative in which GBP traders seem to believe as British pound is the worst performing G10 currency following the release of inflation data today.
Taking a look at EURGBP chart at D1 interval, we can see that a recent brief downward correction was halted by 50- and 200-session moving averages (orange circle). The pair recovered back above the 0.8460 price zone today and it looks like the uptrend will be resumed. If EUR continues to outperform GBP, a resistance zone to watch can be found ranging below 0.8590.
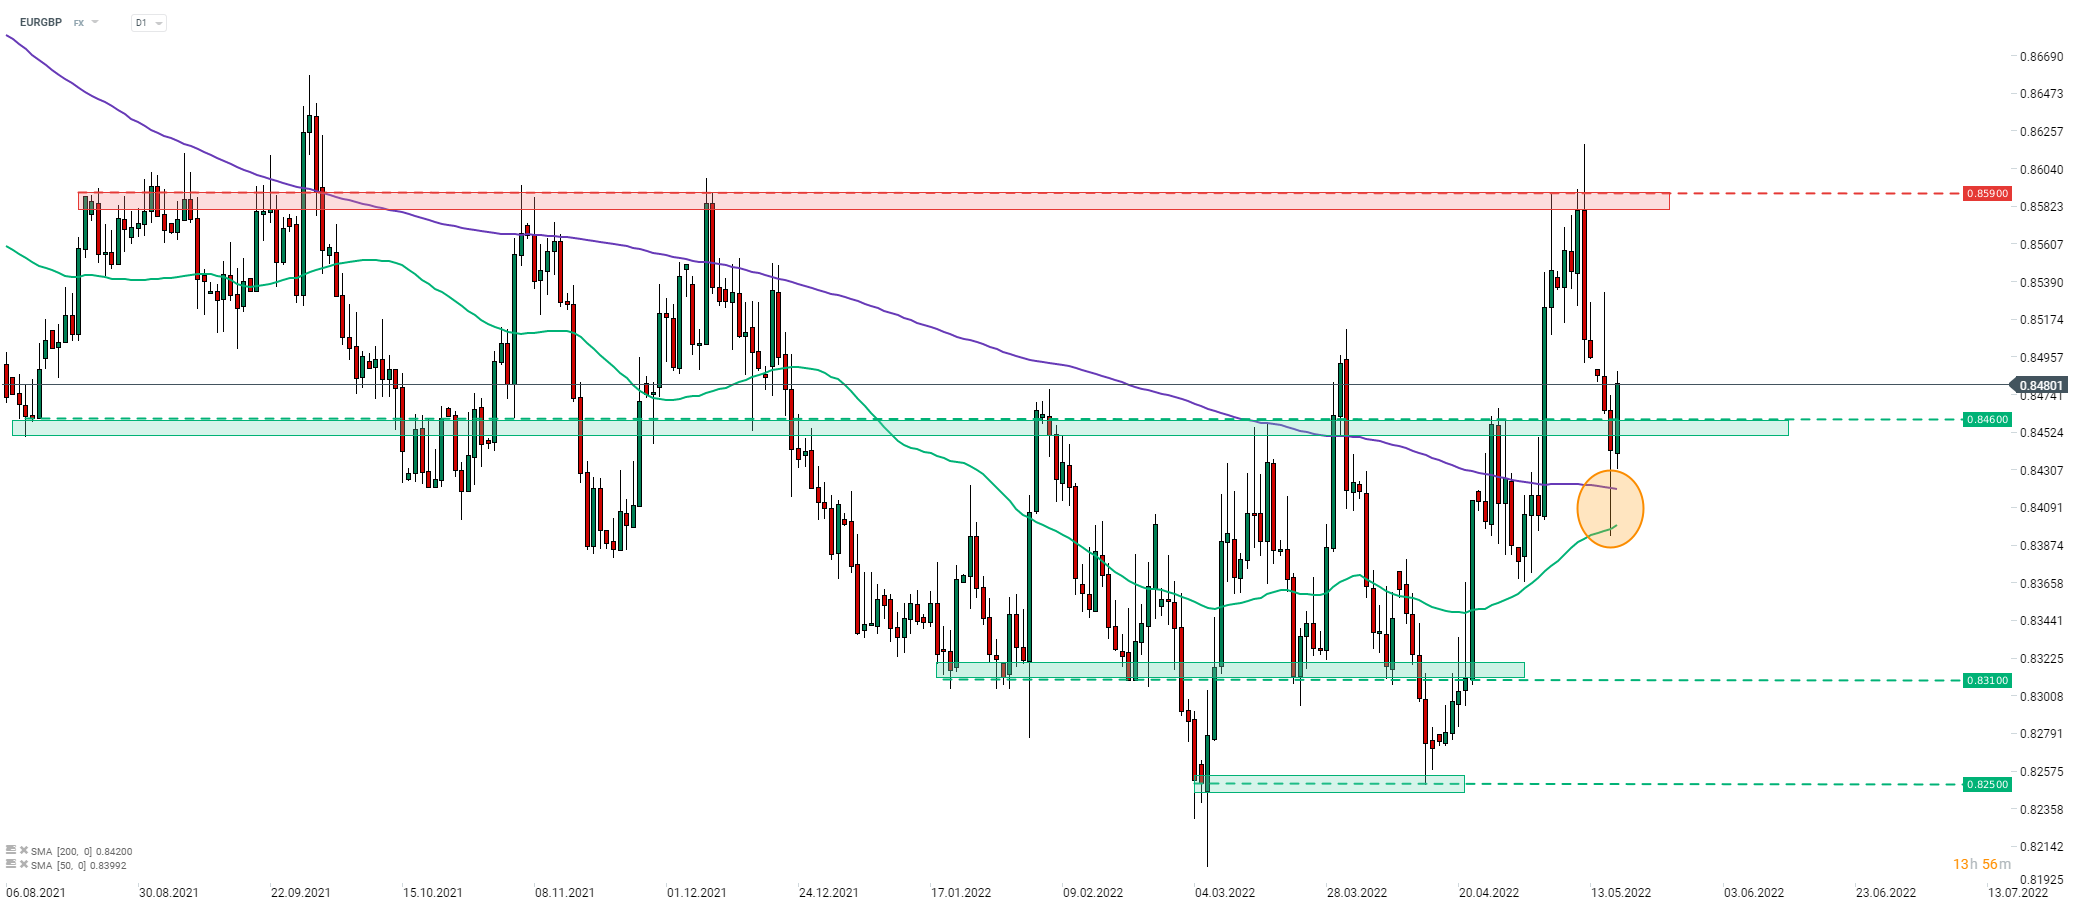 Source: xStation5

Daily Summary: Equities Diverge as Tech Lags, Europe Rallies on Earnings & PMIs (24.07.2026)

Three markets to watch next week (24.07.2026)

BREAKING: Eurozone recovery? Positive PMI data tempered by high oil and gas prices

Economic Calendar: Industry’s condition in the shadow of oil prices