
Gold fell to three-month lows on Friday and is on track for the fourth consecutive week of declines as the hawkish Fed sparked a rally in the dollar, which, in turn, spooked investors away from the precious metals. Price broke below the key support zone around $1830 which coincides with 61.8% Fibonacci retracement of the upward wave started at the end of March 2021, 200 SMA (red line), upward trendline and lower limit of the 1:1 structure. If a downward move deepens further, the next support to watch lies at the $1765, where the 78.6% Fibonacci retracement is located. On the other hand, if buyers manage to regain control, then another upward impulse towards resistance at $1900 may be launched.
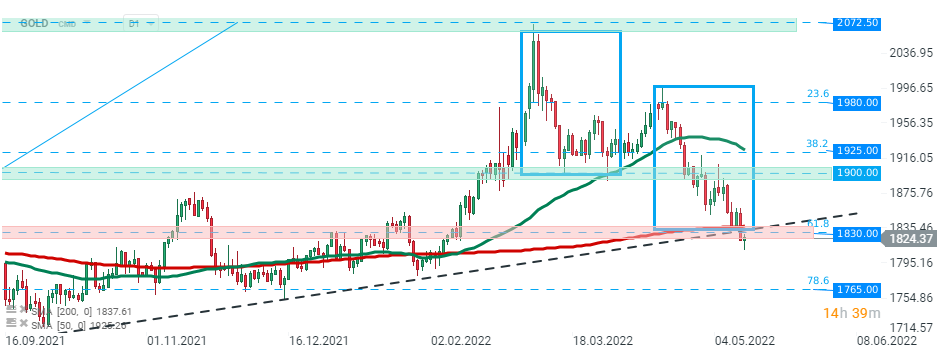
GOLD, D1 interval. Source: xStation5

The coffee market in the grip of weather and empty warehouses: The paradox of record Brazil harvests

Chart of the Day: Who suffers from the oil price drop? (28.07.2026)

Economic Calendar: PayPal, Visa and Coca-Cola to overshadow macro data (28.07.2026)

Morning Wrap: US halt to attacks balanced by semiconductor sector declines (28.07.2026)