



Russian RTS index (RUS50) dropped more than 10% from a recent post-pandemic high at 1,558 pts amid plunge in oil prices. However, the index has found support in the 1,400 pts area as oil prices stabilized. The area is marked with the lower limit of a market geometry, previous price reactions and the upward trendline. RUS50 is bouncing off the area today, thanks to a 2% jump in oil prices. Index launched today's trading above the short-term swing level at 1,425 pts and may now look towards the 1,500 pts area marked with the mid-January and mid-February highs. As the Suez Canal remains blocked, fundamental favours higher oil prices and is in turn beneficial to RUS50 as well.
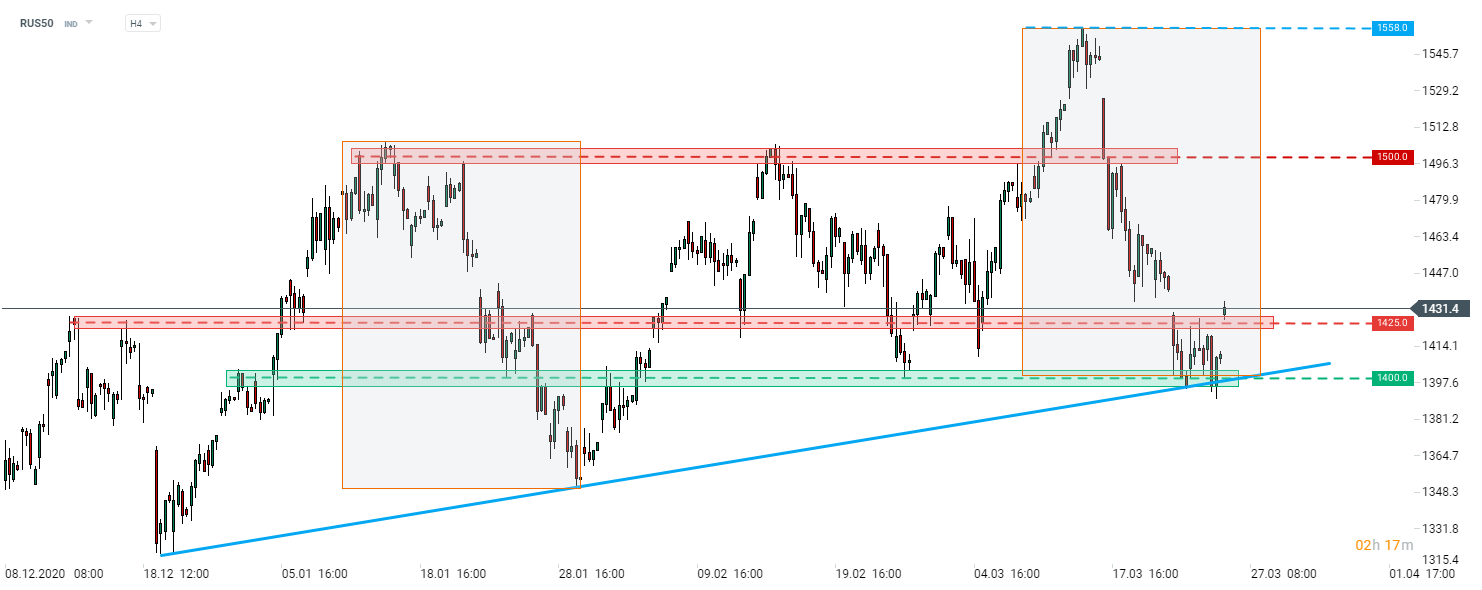 Source: xStation5


US and Iran Make Progress in Talks? Stock Indices and Prcious Metals Rebound


Market Wrap: Wall Street and Global Markets Under Pressure


Chart of the Day: Nasdaq 100 Slips Into Correction 📉 AI Rally Loses Steam - What’s Next for US100? (03.11.2026)


Morning wrap: Stock Indices Fall Again 🚩 Oil Tries To Rebound Following US Strike on Iran’s Qeshm Island (03.11.2026)