US indices took a hit yesterday after Treasury Secretary Yellen said that interest rates may have to increase in order not to overheat the economy. US100 was one of the hardest hit Wall Street indices as it dropped around 2%. However, Yellen has backtracked on her comments later on saying that she is not trying to predict the Fed interest rate path and that she respects the central bank's independence. Indices began to recover but continue to trade below levels from before Yellen's first remarks.
Taking a look at the US100 chart, we can see that the index has found itself in an interesting technical place. Index painted a double top pattern at the end of April and yesterday's plunge pushed the price below the neckline of the pattern (13,725 pts). Moreover, the daily low was reached at around 13,380 pts - the potential target of the double top pattern. Having said that, US100 may be set to extend recovery now. The aforementioned 13,380 pts mark, that more or less coincides with the 38.2% retracement of the upward move started in March can be seen as the near-term support to watch.
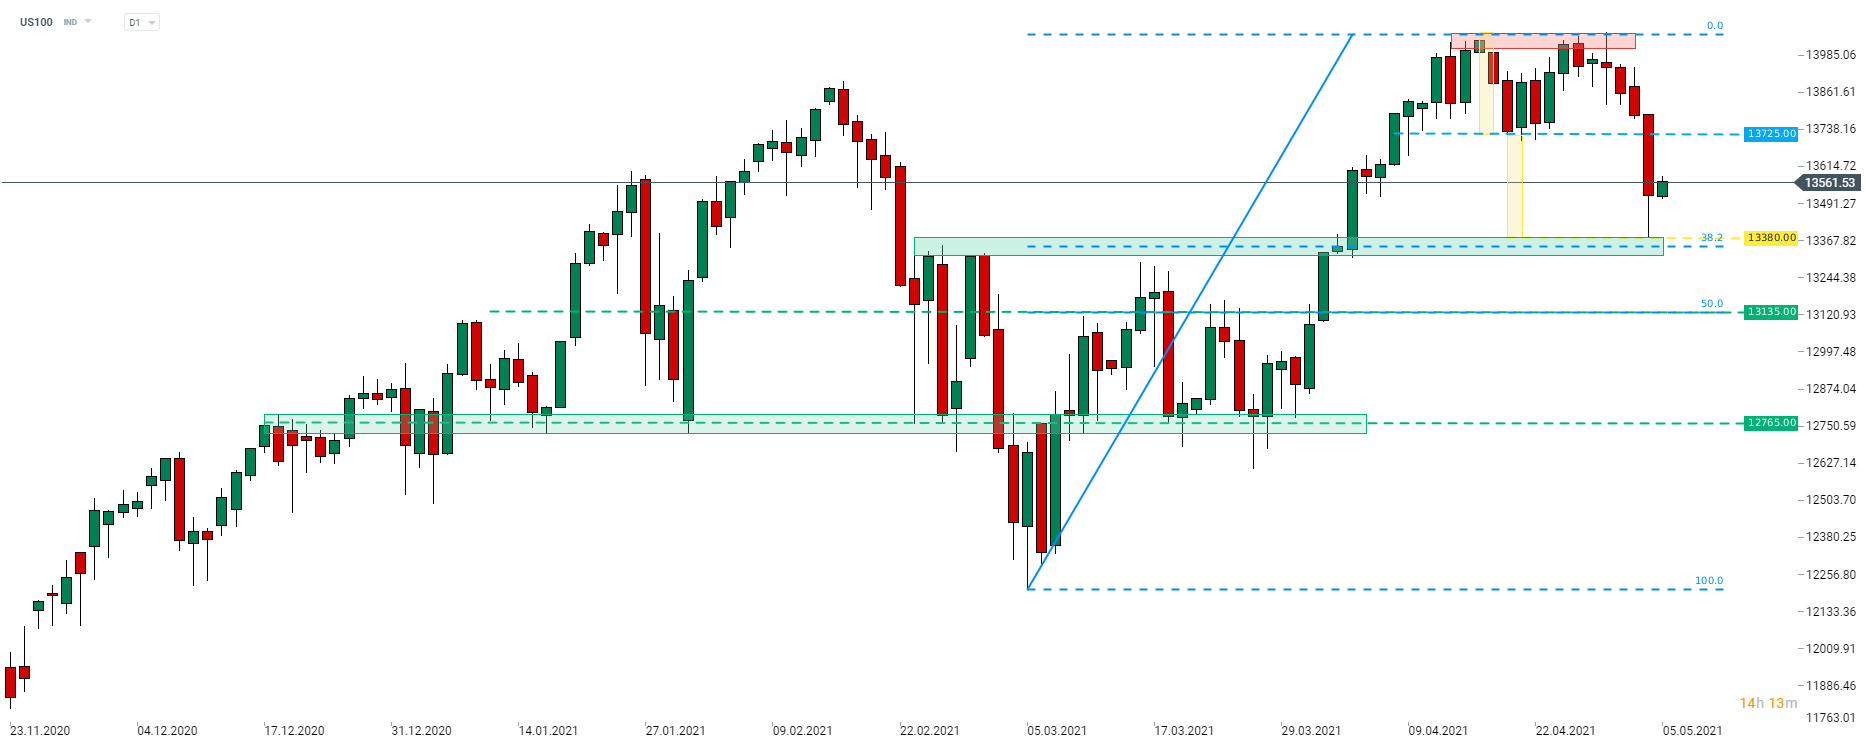 Source: xStation5

Daily Summary: Equities Diverge as Tech Lags, Europe Rallies on Earnings & PMIs (24.07.2026)

Three markets to watch next week (24.07.2026)

US OPEN: Nasdaq hits 1-month low! Geopolitics bring AI trade down!

Market Wrap: European Stocks Are Trying to Rebound as the Week Comes to an End💡