
Cryptocurrencies are trying to “stabilize” after the recent, sharp sell-off, while Bitcoin continues to consolidate between $65,000 and $70,000, closing a fourth consecutive week in the red. Even so, the market still lacks a decisive demand response that would allow Bitcoin to reclaim and hold above $70,000 for longer. cMichael Saylor suggested over the weekend that the company remains highly resilient to a potentially prolonged bear market. However, corporate demand for BTC is weakening. In January, 97.5% of purchases were attributed to Strategy (MSTR.US).
-
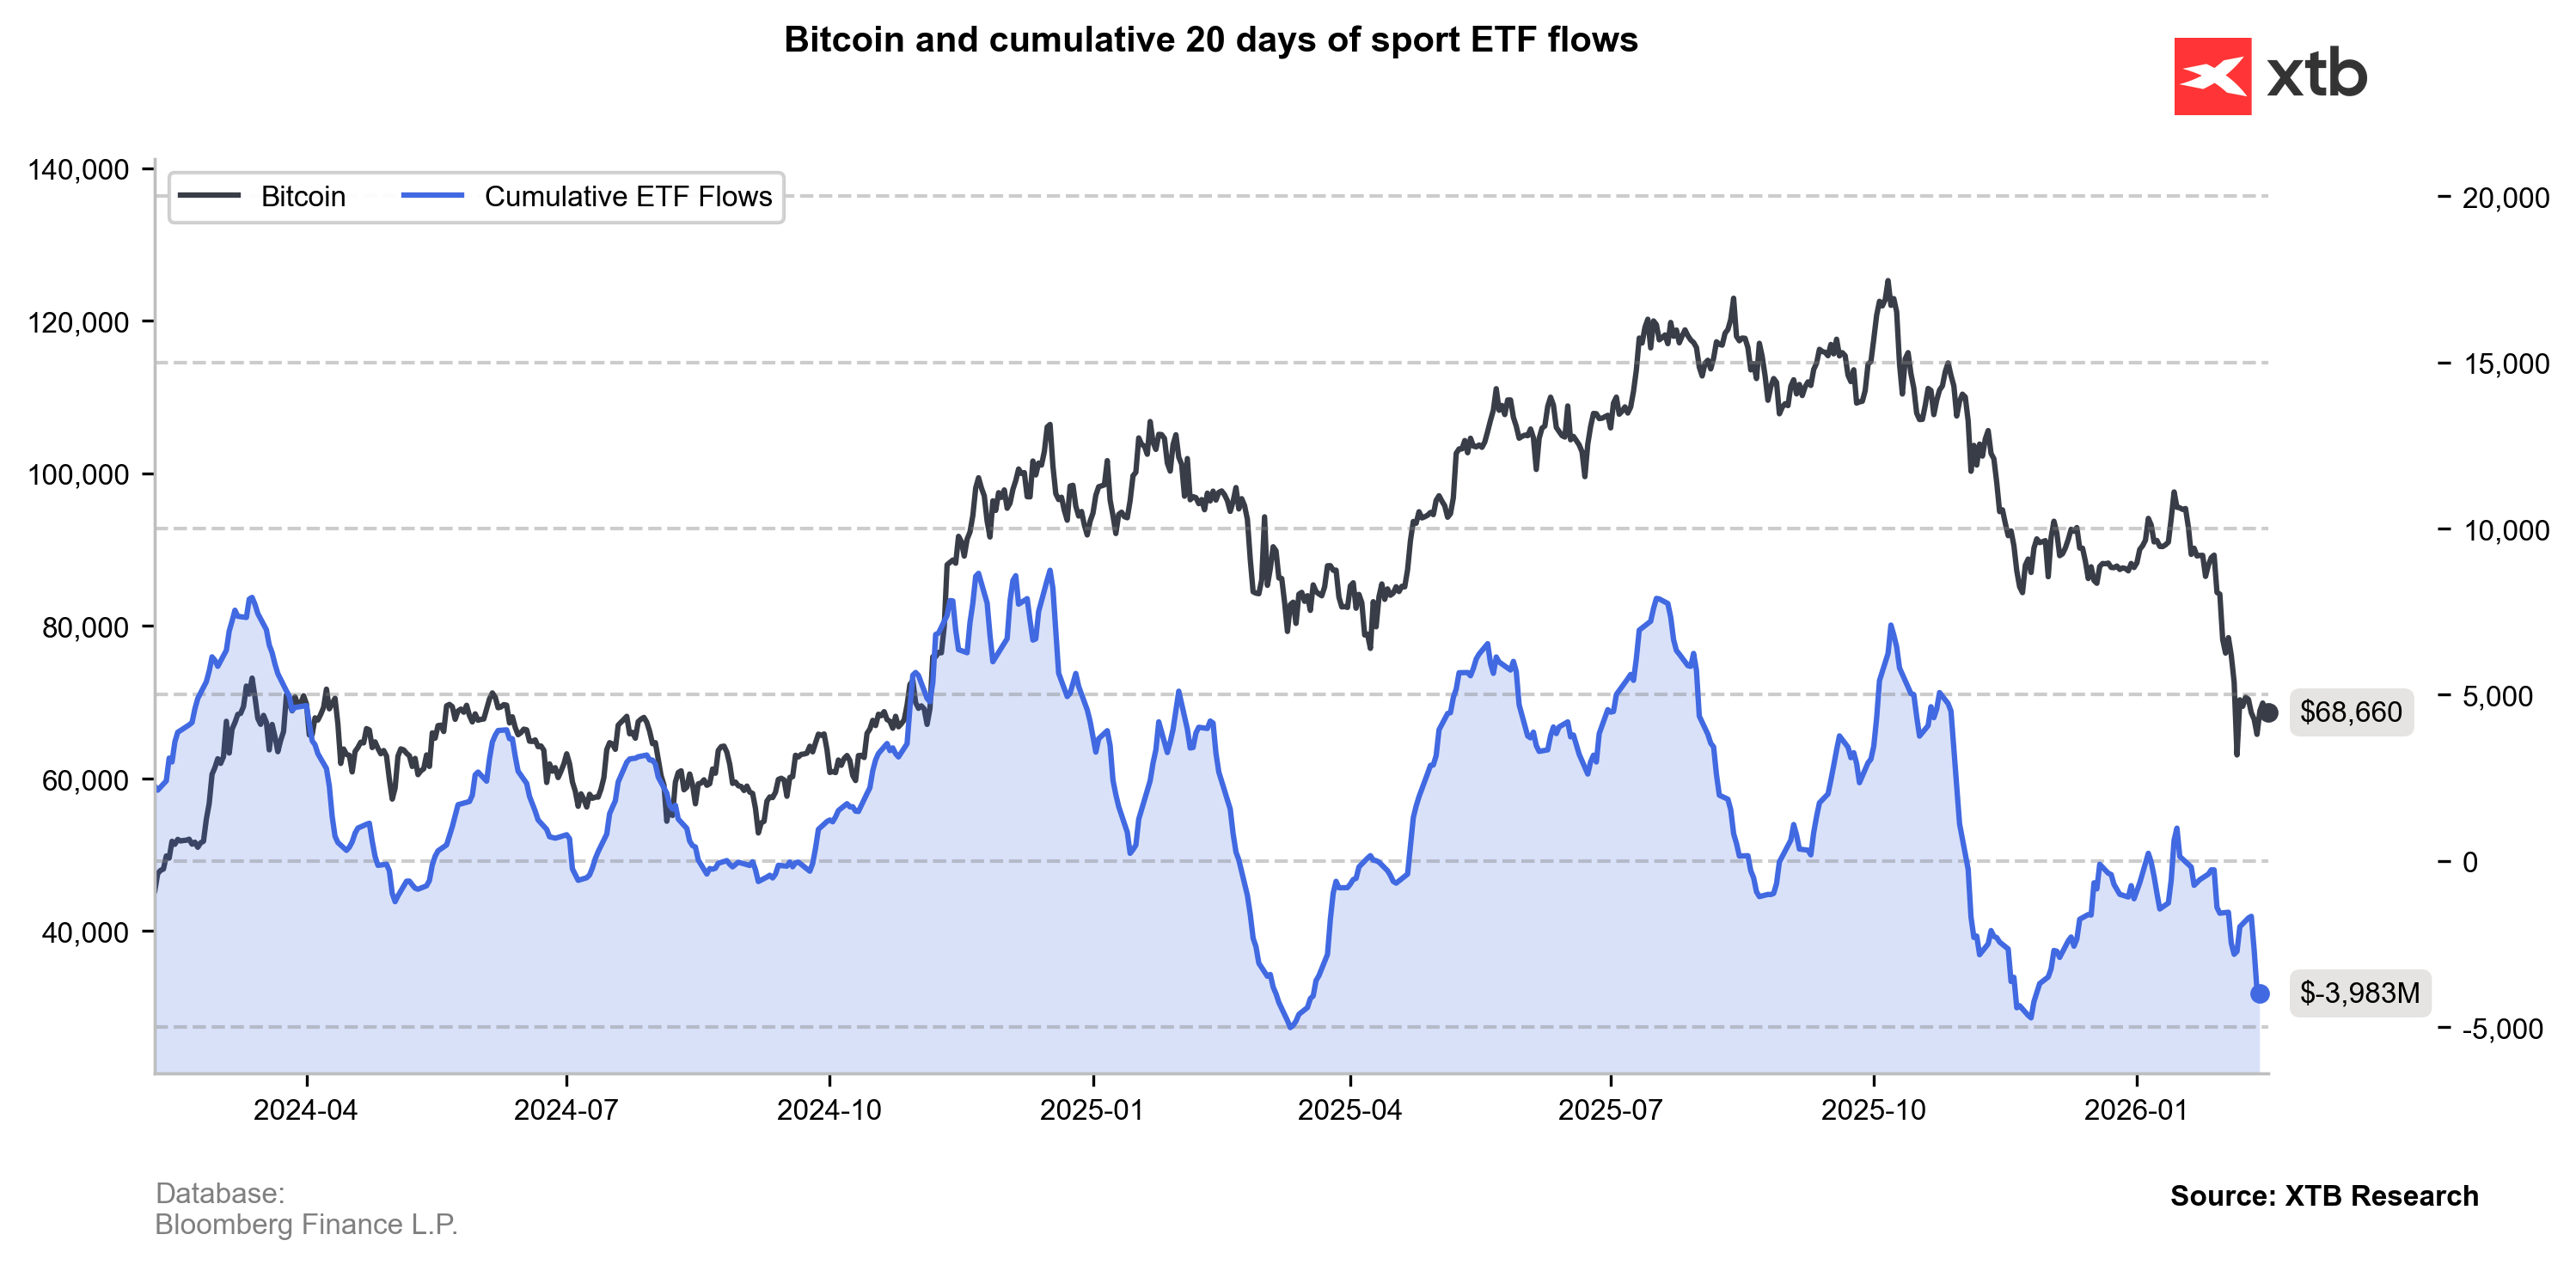
On-chain data point to very limited inflows into Bitcoin and slowing activity in futures and options, with a clearly dominant demand for downside hedging still in place.
-
The $60,000 area remains a key support zone—psychologically, from a price-action perspective, and in terms of investor positioning. A break below it would likely trigger large-scale long liquidations.
-
The fund associated with Harvard University reduced its Bitcoin exposure by 21%, while increasing its Ethereum holdings to $87 million.
-
According to Mike McGlone, Bitcoin could fall as low as $10,000 due to a “narrative crisis” and a fundamental shift in sentiment - especially after failing to track gold’s rise and significantly underperforming equity indices, while remaining far more volatile.
-
A 10% rise in Bitcoin would currently trigger about $4.34 billion in short liquidations, while a 10% drop would imply roughly $2.35 billion in long liquidations.
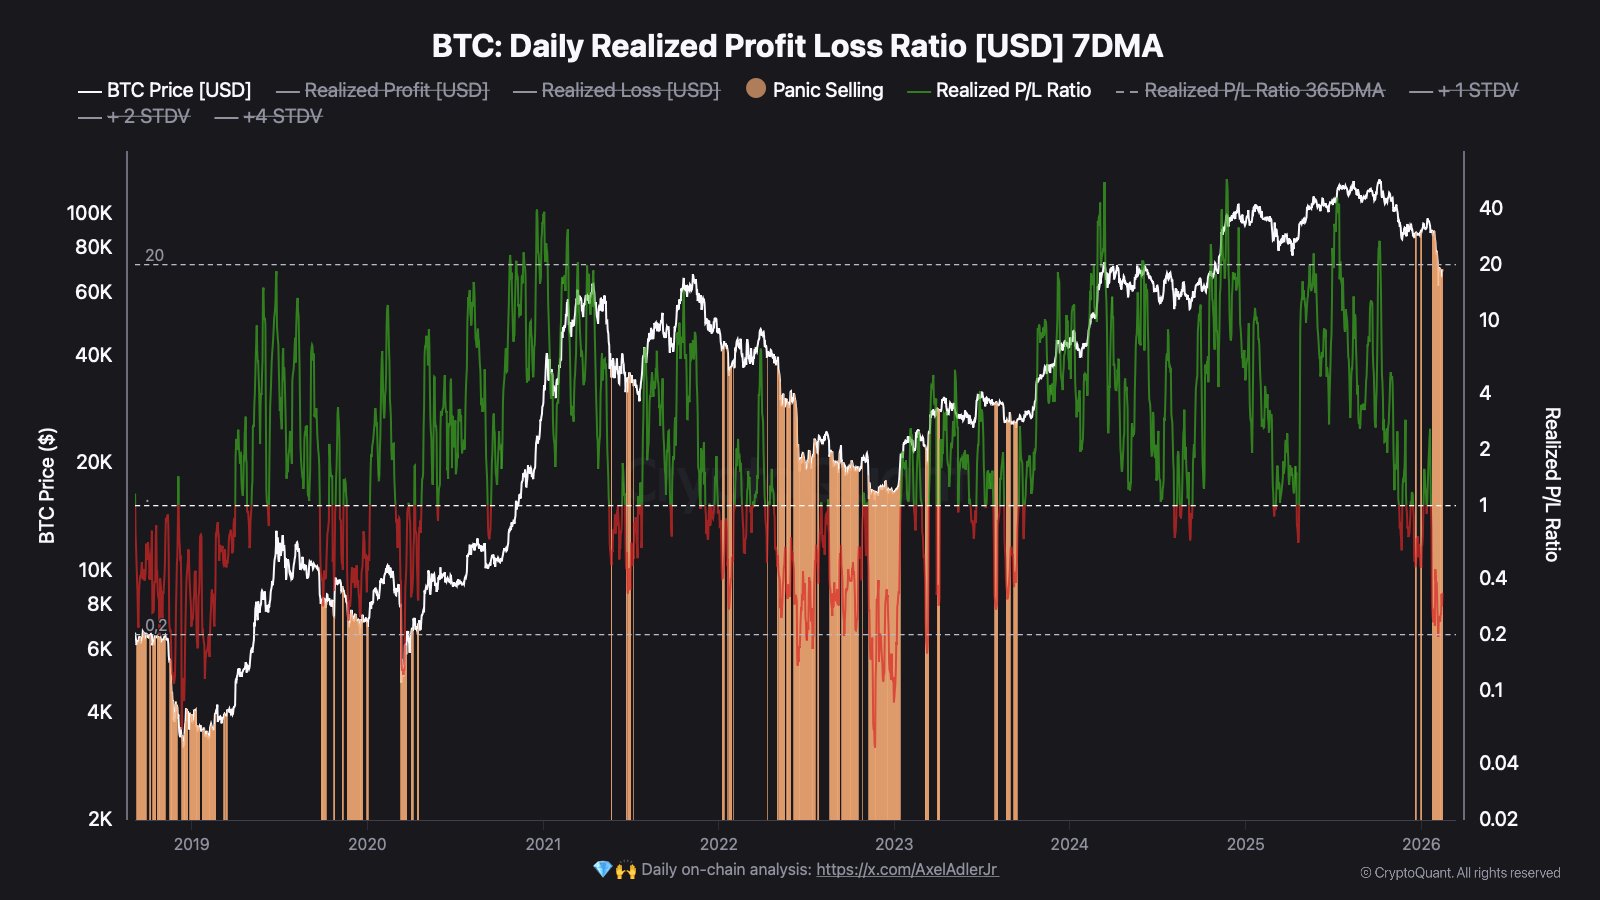
What do CryptoQuant’s on-chain data say?
Most importantly, on-chain data appear to suggest - almost unanimously—that $60,000 is not the “bottom” of this bear market. This is indicated by both SOPR and the deviation from Realized Price, which has acted as a key barrier in past bull and bear markets. According to CryptoQuant, the “ultimate” bear market bottom for Bitcoin lies around $55,000. From an on-chain perspective, key indicators remain in a Bear Phase, rather than the Extreme Bear Phase historically seen at cycle lows. In other words: the market is under pressure, but not yet in the kind of capitulation extreme that has marked definitive bottoms in the past. The current structure looks like deepening weakness—still short of the classic, cycle-cleansing panic that typically precedes a new upside impulse.
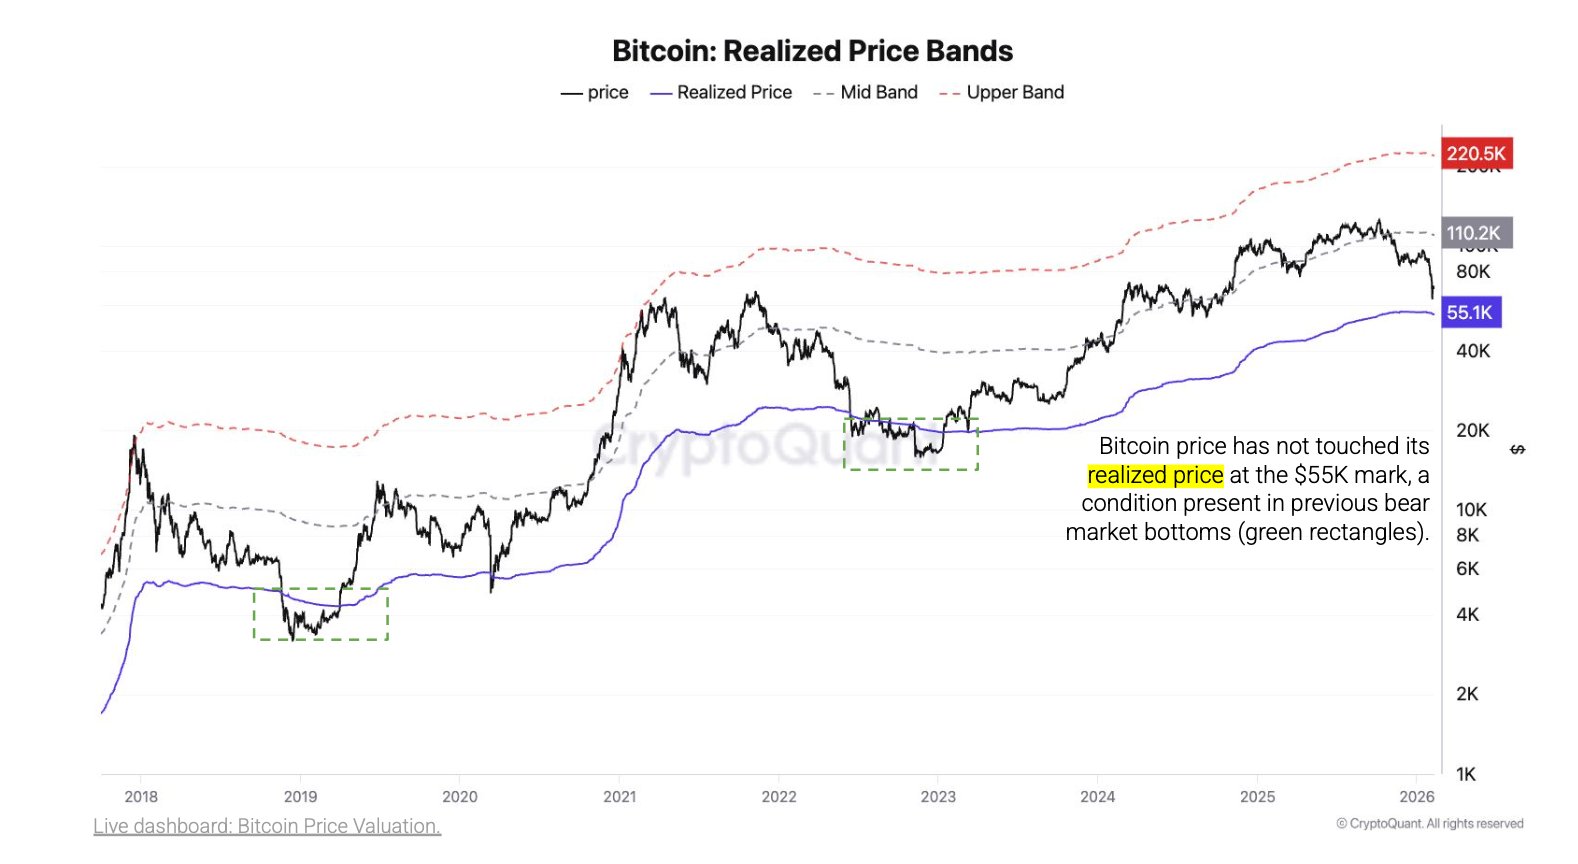
Source: CryptoQuant
Bitcoin’s Adjusted SOPR (aSOPR) has dropped again toward the 0.92–0.94 zone—a level that historically appeared during the most intense stress in bear markets. aSOPR measures whether BTC moved on-chain is being sold at a profit or at a loss.
-
A value above 1 indicates profit-taking.
-
A value below 1 indicates selling at a loss.
-
Readings around 0.92-0.94 imply that BTC changing hands is being sold at an average loss of roughly 6–8%. This is not a “normal correction.” Historically, these are levels where weaker hands have tended to capitulate.
Historically, such readings showed up:
-
in the late stages of bear markets,
-
during sharp sell-offs,
-
when sentiment was extremely negative and panic-driven supply dominated demand.
From an on-chain standpoint, this is a signal of structural stress: the market is flushing excess leverage and emotional capital. Paradoxically, these zones have often been where long-term bottoms were built, as short-term capitulation transferred coins into stronger, more patient hands. A drop in aSOPR to 0.92–0.94 doesn’t tell us “this is the bottom.” It tells us the market has entered an area historically associated with pain, forced selling, and a reset in expectations.
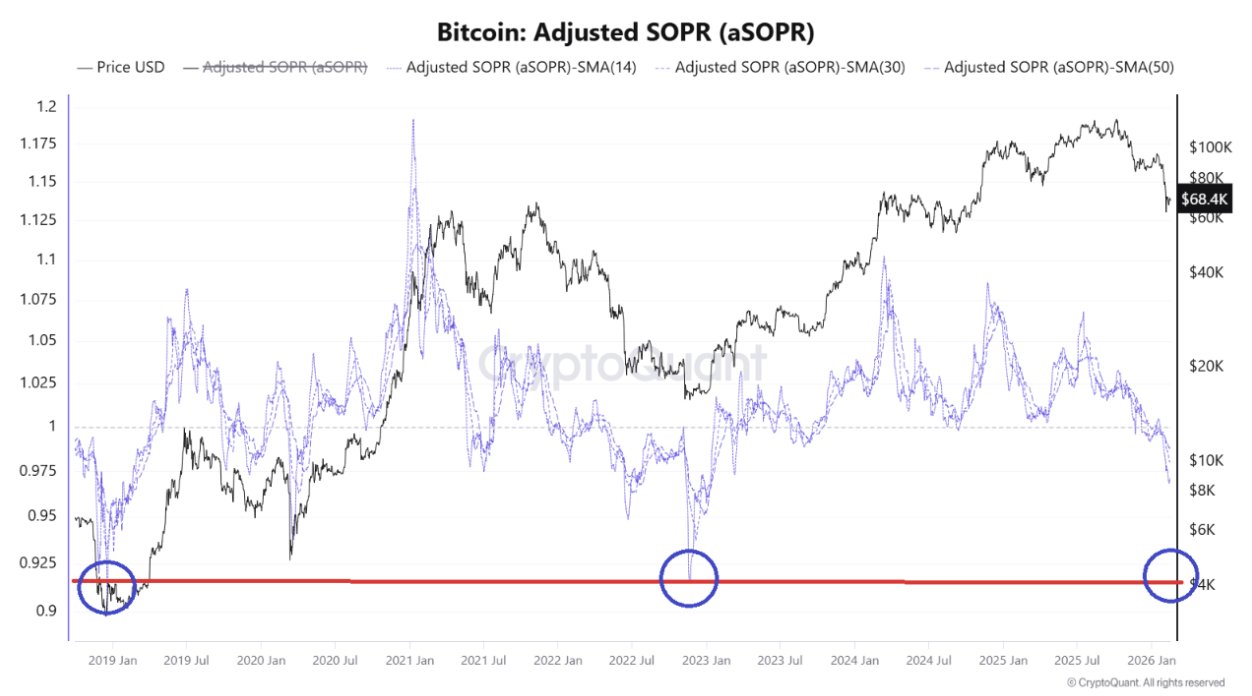
Source: CryptoQuant
 Source: XTB Research, Bloomberg Finance L.P.
 Source: XTB Research, Bloomberg Finance L.P.
Bitcoin and Ethereum (D1 timeframe)
From a technical perspective, both cryptocurrencies—despite an already difficult setup—still carry an elevated risk of another downside impulse similar to the 2022 bear market. On the other hand, a move back above $80,000 and a V-shaped rebound would materially improve the signal set and reduce the risk of a prolonged bear phase.
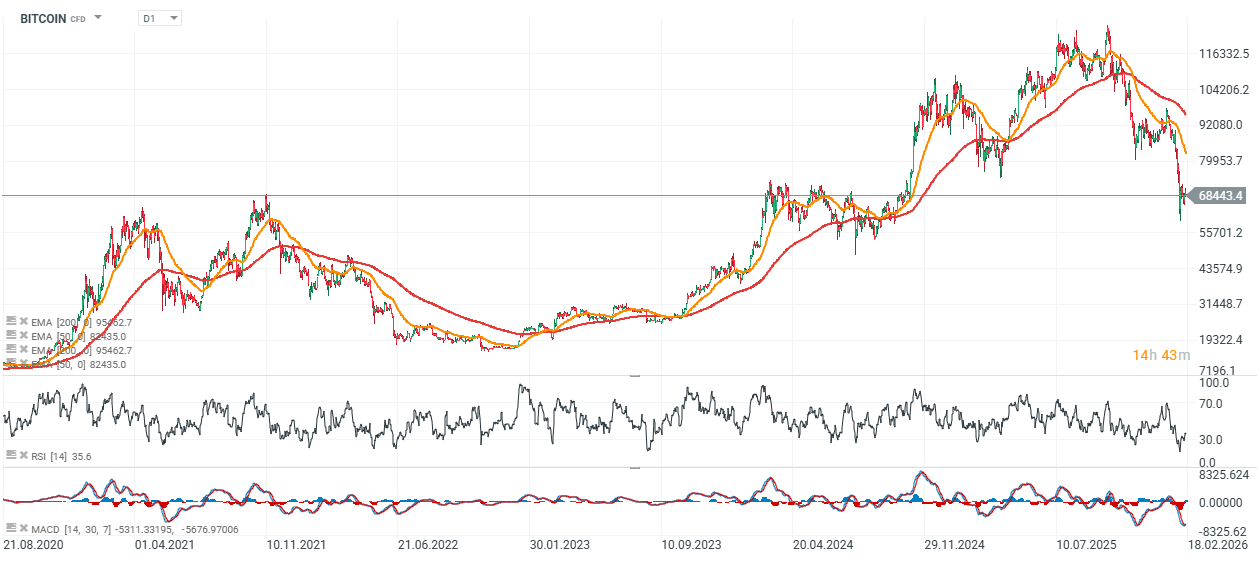
Source: xStation5
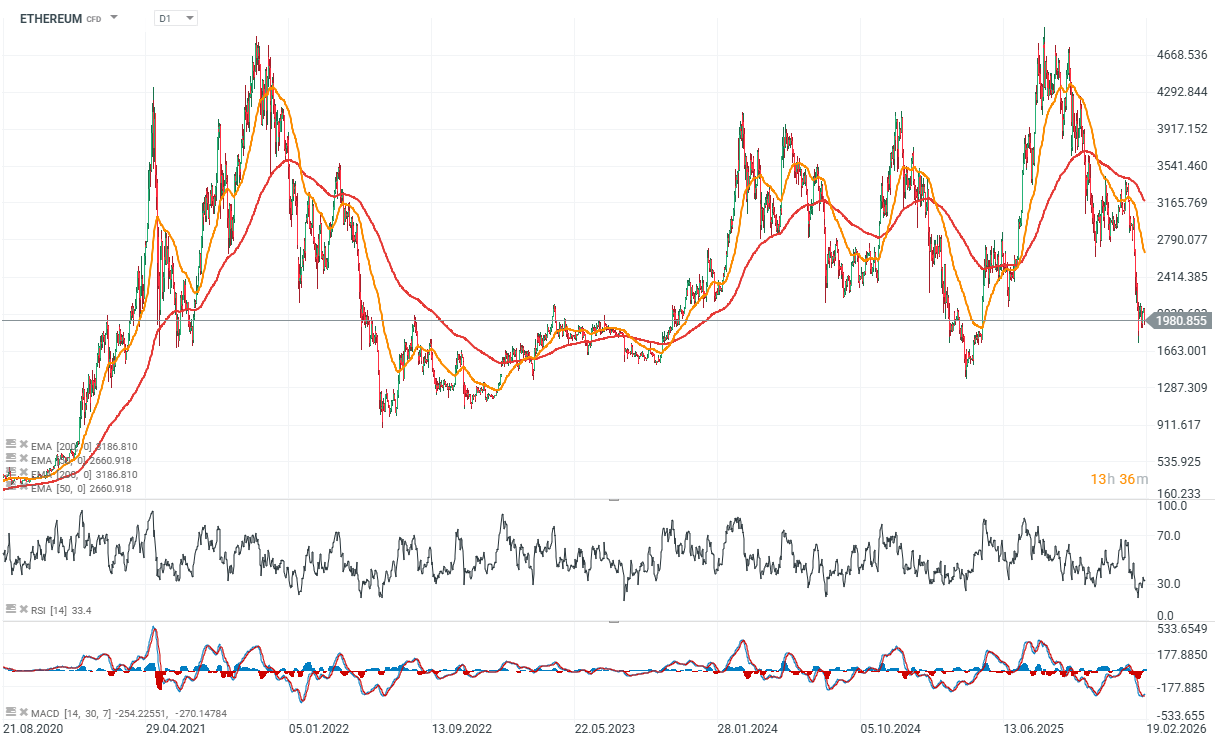
Source: xStation5
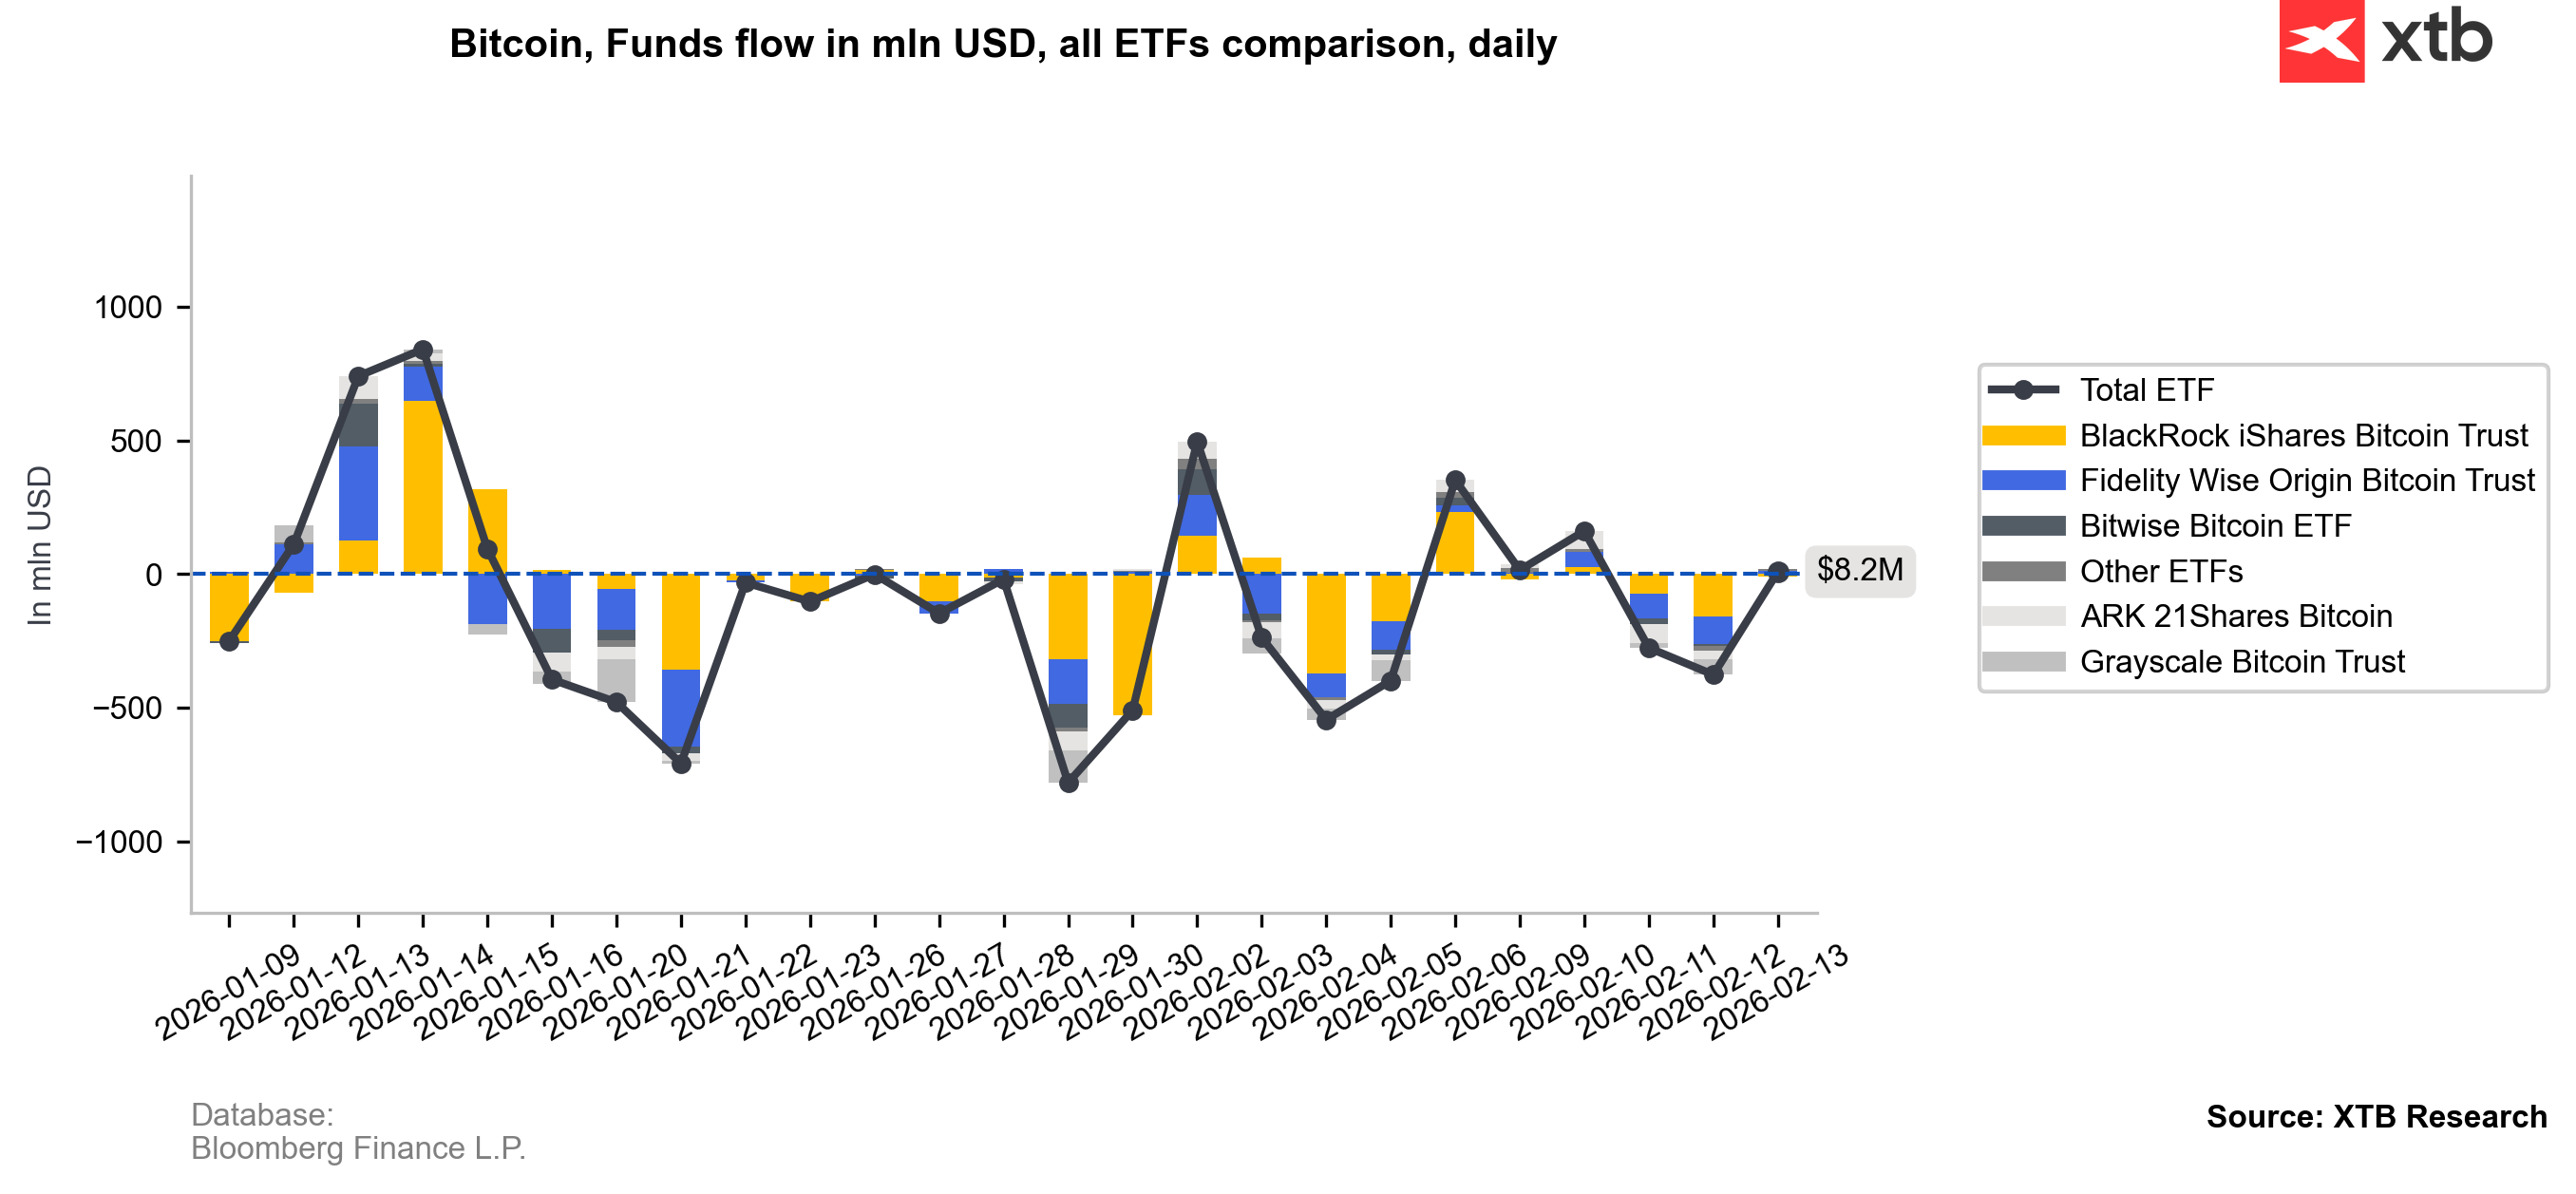
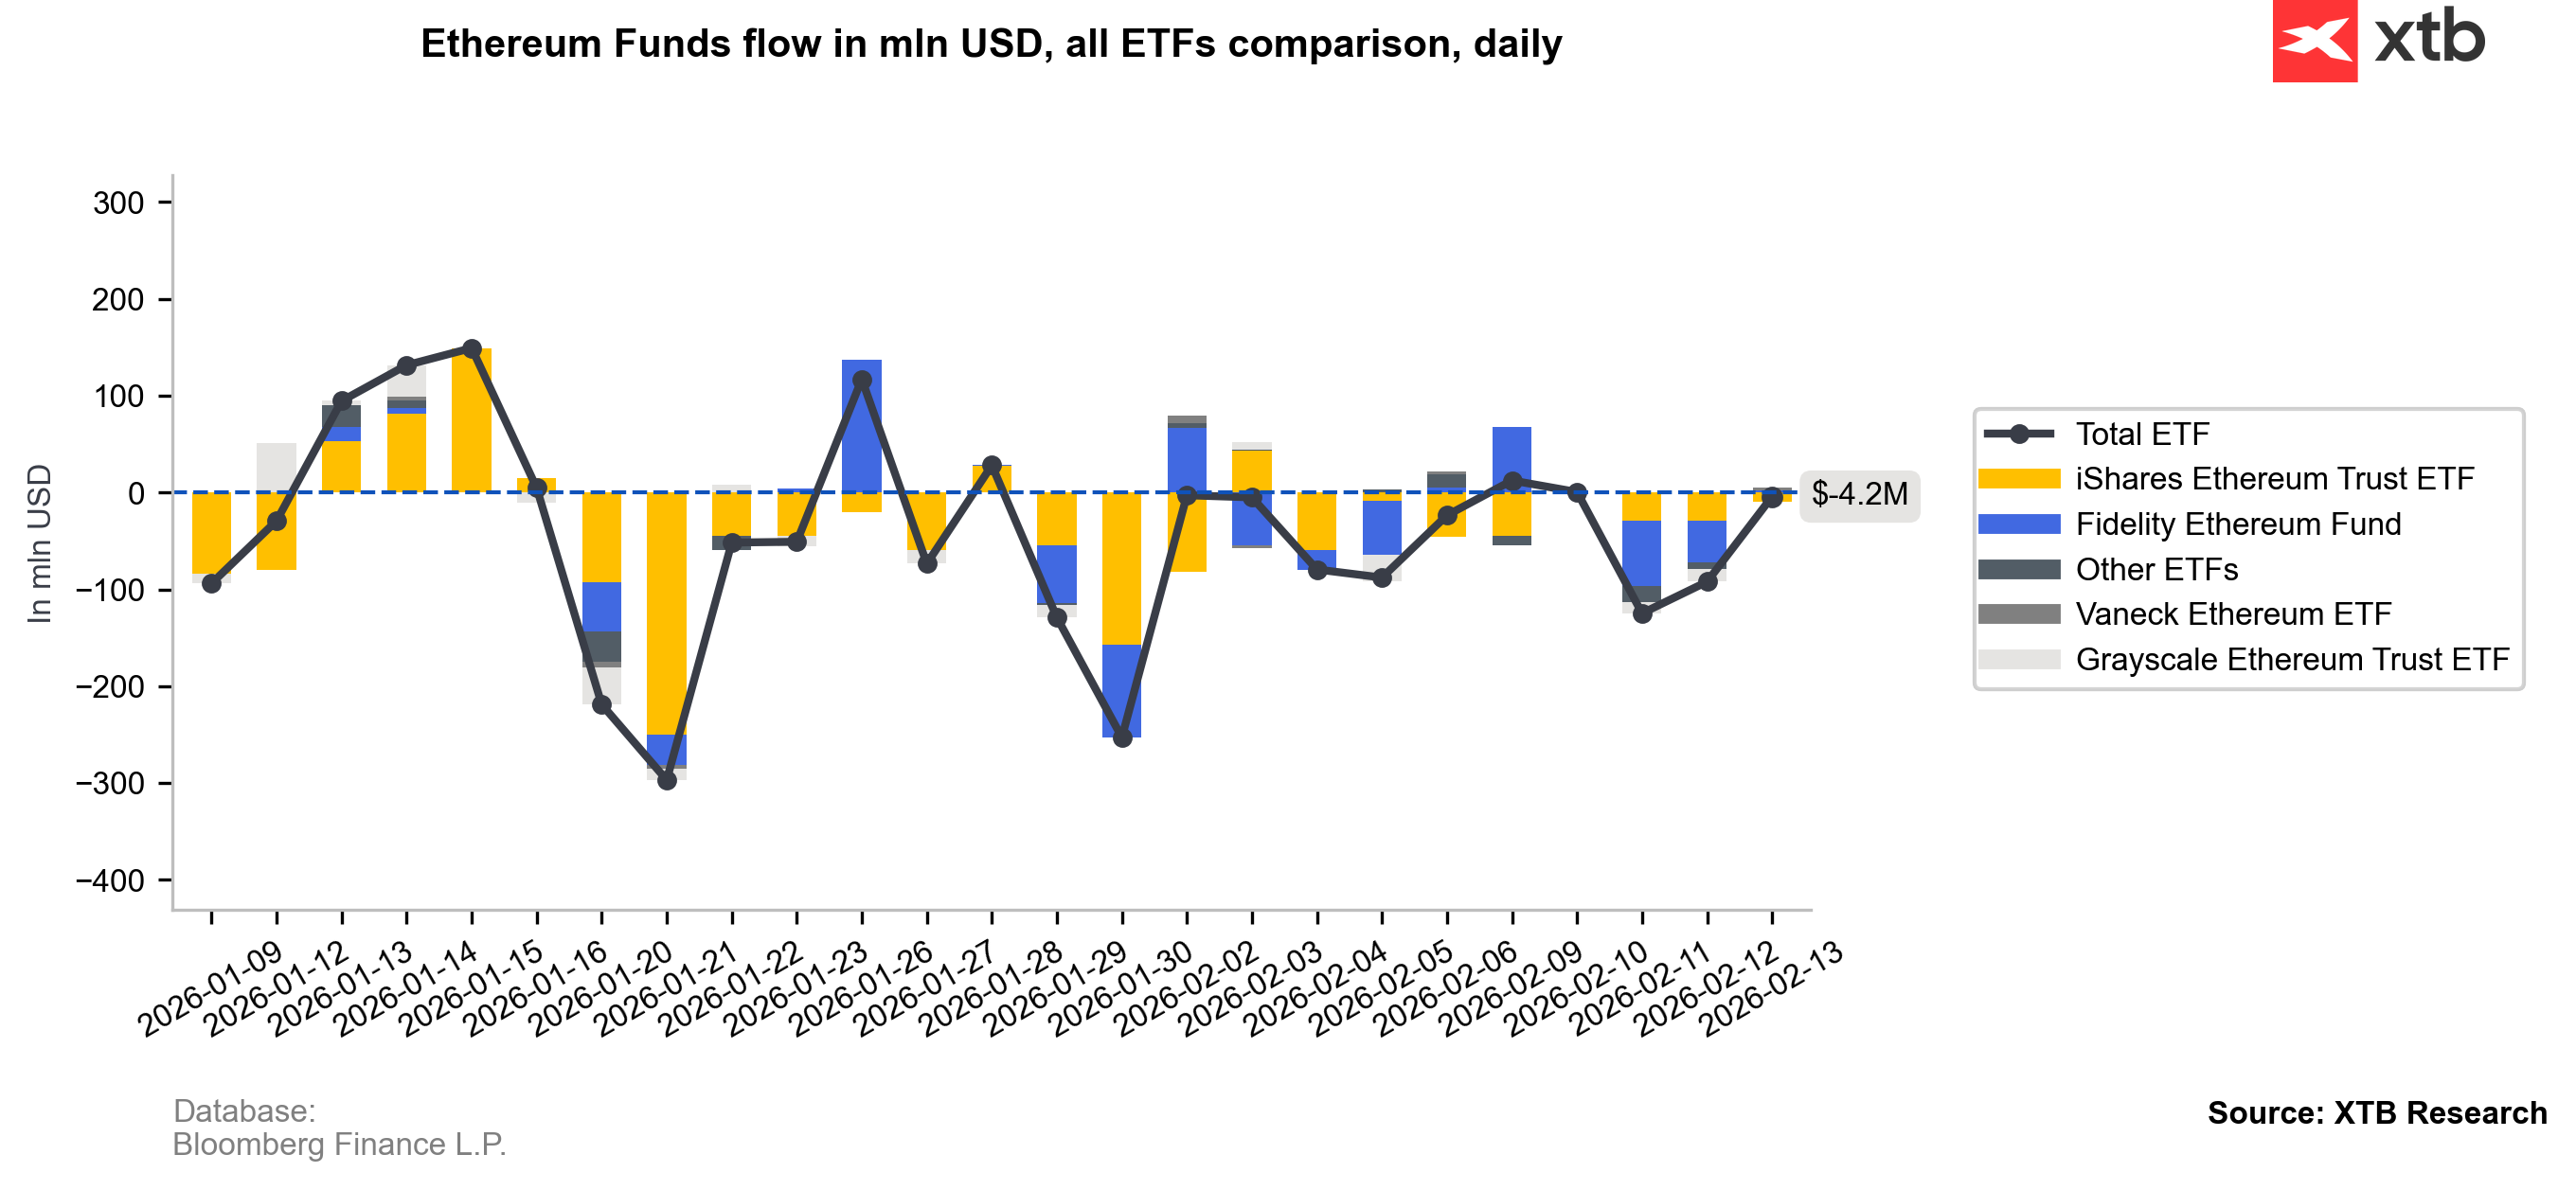
ETF flow waves also confirm that U.S. funds contribute to the broader slowdown: recently, they have shown relatively limited buying activity, with sales predominating.
 Source: XTB Research, Bloomberg Finance L.P.
Source: CryptoQuant

Daily Summary: Wall Street Regains Ground; Another Intervention in the Yen Market❓

Three Markets to Watch Next Week (July 31, 2026)

Market Wrap: European equities at 3-week highs! Apple dips in US premarket!

Euro Area core inflation above estiamtes! EURUSD under key resistance!