
Today's session is marked by the recovery of the risk-on sentiment in the markets, despite the initial drops in equities during the European session.
In the forex market, the pair EUR/USD continues to consolidate, after the strong drops registered after the publication of the CPI data in the US.
1 hour Time Frame Chart
On the 1-hour chart, we can see that the price is still sideways after the last big drop recorded.
However, it is possible to limit the movements through the chart pattern - expanding channel.
As such, the upper bound of the structure could be the next obstacle to short-term buying force and could dictate new bearish momentum if sellers manage to regain control of the price.
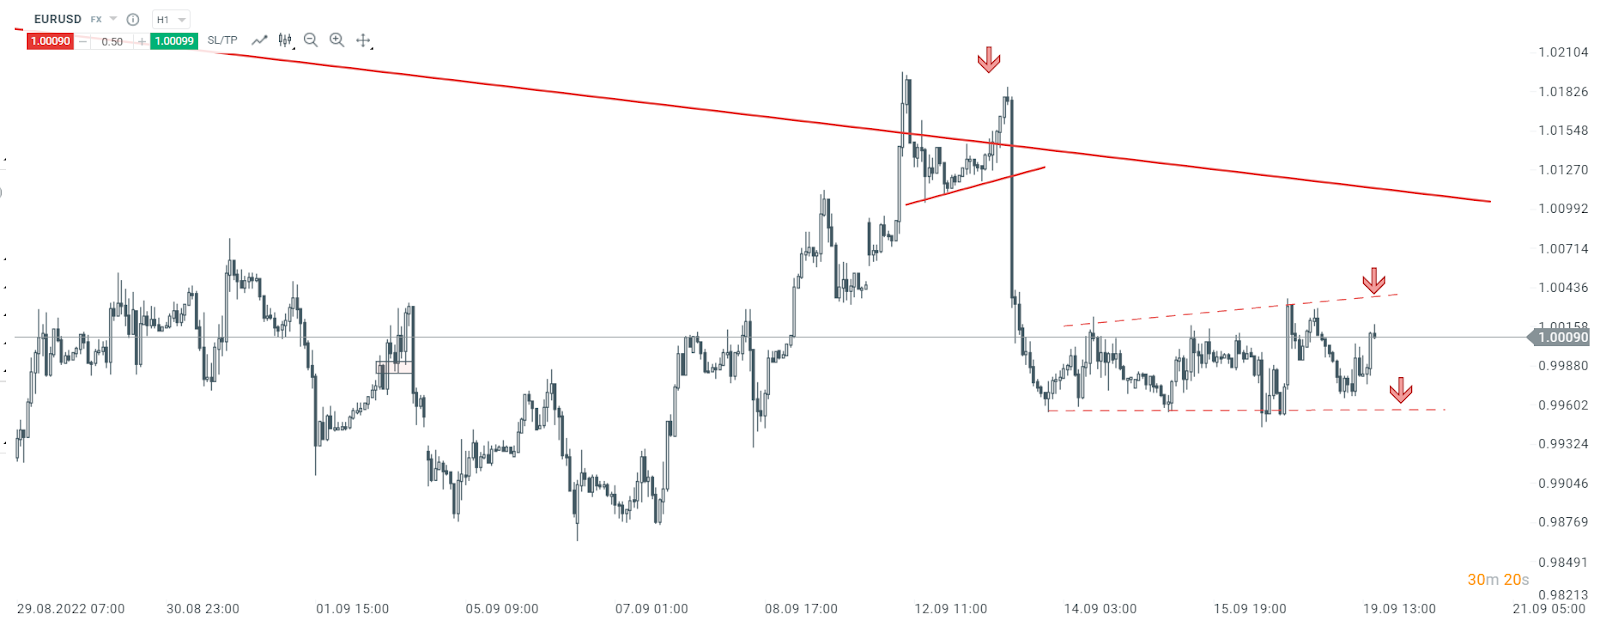
EUR/USD, 1 hour time frame chart. Source: xStation
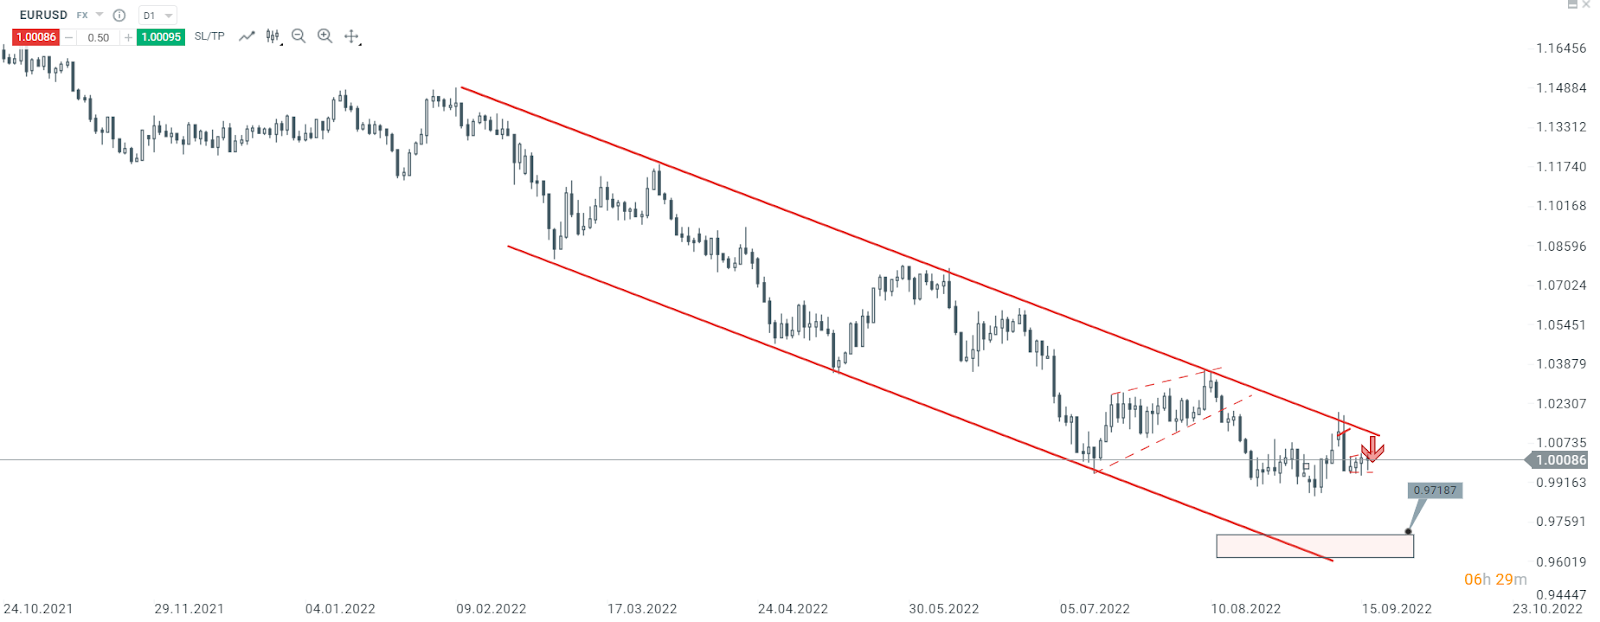
EUR/USD, Daily Time Frame Chart. Source: xStation 5
During this session, EUR is leading the gains.
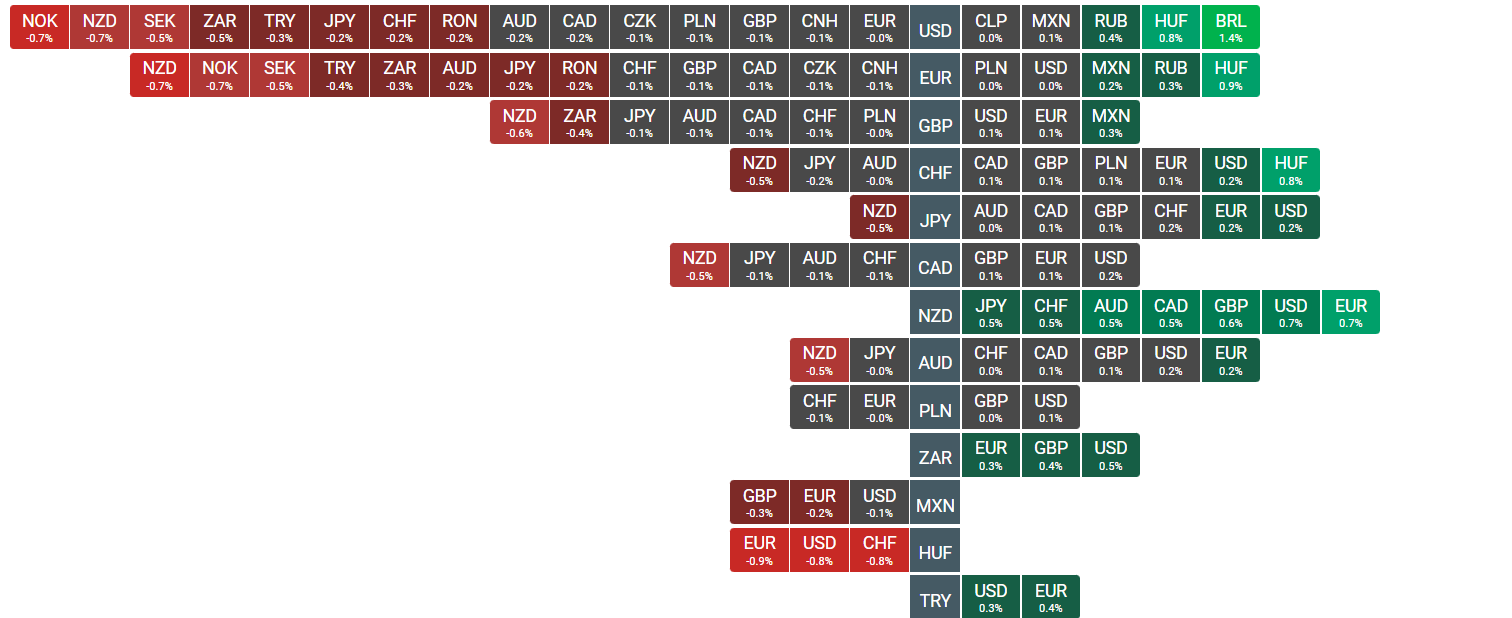
Heatmap. Source: xStation 5
Henrique Tomé, XTB Portugal

🔴European TTF gas prices fall by 7.5%

Daily Summary: Equities Diverge as Tech Lags, Europe Rallies on Earnings & PMIs (24.07.2026)

Three markets to watch next week (24.07.2026)

BREAKING: Eurozone recovery? Positive PMI data tempered by high oil and gas prices