
Nvidia (NVDA.US) is the flagship name of the AI trend and remains the world’s largest publicly listed company, yet despite strong results from its key business partner, TSMC (TSM.US), the stock is now down nearly 20% from its October 2025 all-time high, when investors were paying more than $211 per share.
- Valuation has come down meaningfully, and if the company delivers in line with its 12-month earnings forecast, Nvidia is now priced roughly in line with the Nasdaq 100 average. Still, despite the “more attractive” valuation, the near-term downtrend remains dominant and profit-taking appears to be accelerating.
- Looking at the chart, the technical setup is becoming increasingly uncomfortable for buyers. Price action is starting to resemble a head-and-shoulders pattern (H&S), a classic trend-reversal formation. If the pattern plays out, the stock would likely slide toward the neckline area around $168 per share, marked by the local lows from September and December 2025.
- That would also imply a test of the 200-day EMA (red line). The pattern’s projection suggests Nvidia could break below both the EMA200 and the neckline, potentially flipping the broader trend. In that scenario, a key longer-term support level could emerge around $135 per share, reinforced by the consolidation zone from late May and early June last year.
That said, a breakdown is not a done deal. A move back above $186 per share (the EMA50) could signal a return to the uptrend. Nvidia is scheduled to report earnings on February 26, after the Wall Street close.
Nvidia shares (D1)
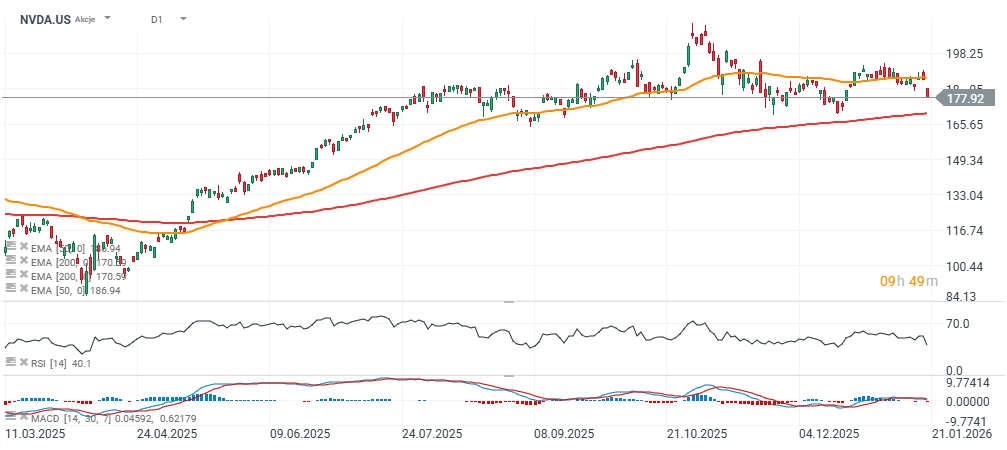
Source: xStation5

Daily Summary: Equities Diverge as Tech Lags, Europe Rallies on Earnings & PMIs (24.07.2026)

US OPEN: Nasdaq hits 1-month low! Geopolitics bring AI trade down!

Market Wrap: European Stocks Are Trying to Rebound as the Week Comes to an End💡

Alphabet shares are down 22% from their all-time high 🚩 Is Google ready to resume its bull run?