



U.S. crude oil inventories fell by 8.557 million barrels, while the market had expected an increase of 0.150 million barrels; inventories had declined by 3.186 million barrels previously. The draw in crude and distillate inventories was not offset by the increase in gasoline stocks, which came in far above expectations.
- Gasoline inventories rose by 3.518 million barrels, well above the expected decline of 0.911 million barrels; inventories had increased by 0.382 million barrels previously.
- Distillate inventories fell by 2.527 million barrels, more than the expected decline of 1.720 million barrels; inventories had decreased by 0.042 million barrels previously.
- Crude inventories at the Cushing hub increased by 1.862 million barrels, compared with a rise of 0.444 million barrels in the previous week.
U.S. oil market tightens as inventories fall below seasonal norms
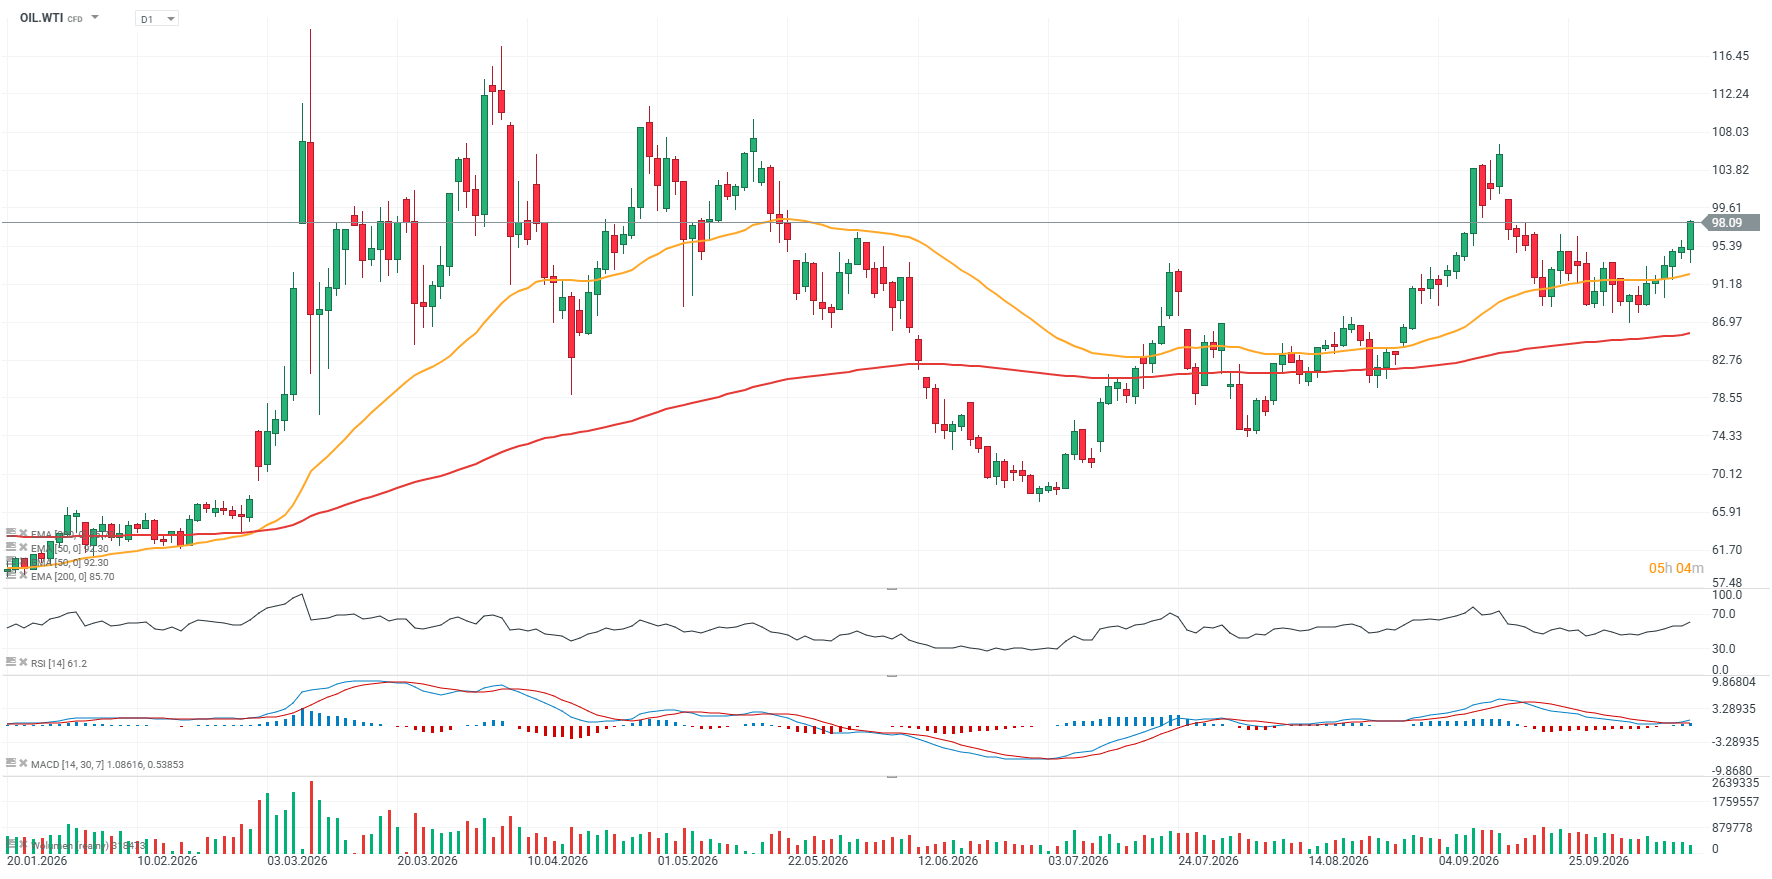
The latest EIA report reinforces a relatively supportive short-term picture for the U.S. oil market. Commercial crude inventories are now 3% below the five-year average for this time of year, while total commercial petroleum stocks fell by a substantial 13.4 million barrels, indicating that the broader inventory draw extended well beyond crude alone. Refinery activity remained strong, with crude inputs averaging 16.6 million barrels per day, up 135,000 bpd from the previous week, and utilisation reaching a high 93.5% of operable capacity. At the same time, crude imports fell sharply by 791,000 bpd to 6 million bpd, reducing the amount of foreign supply entering the domestic system and helping explain the larger-than-expected inventory draw. Gasoline production increased to an average of 9.2 million bpd, suggesting refiners are still responding to downstream demand despite already elevated utilisation rates. Taken together, the combination of lower inventories, reduced imports and strong refinery runs is fundamentally supportive for WTI, although the rise in gasoline stocks means the demand side of the report is not uniformly bullish.
OIL.WTI chart (D1 interval)
 Source: XTB


U.S. indices attempt to rebound after recent losses


Hot inflation data from the US🔥📈 PPI and retail sales are rising!


Nickel market panic 🚩 INSG revises forecast, surplus in 2027?



Market Wrap: Tech Sell-Off Hits Europe, Gold Shines Again