
Looking at the platinum chart from a technical point of view, one can see that the price bounced off the key support recently ($900 area). Green zone on the chart is marked with the lower limit of 1:1 structure and previous price reactions. This area is also strengthened by the upward trendline. As long as platinum is trading above, upward move looks to be the base case scenario. The nearest resistance lies at $1,025, where the YTD highs are located.
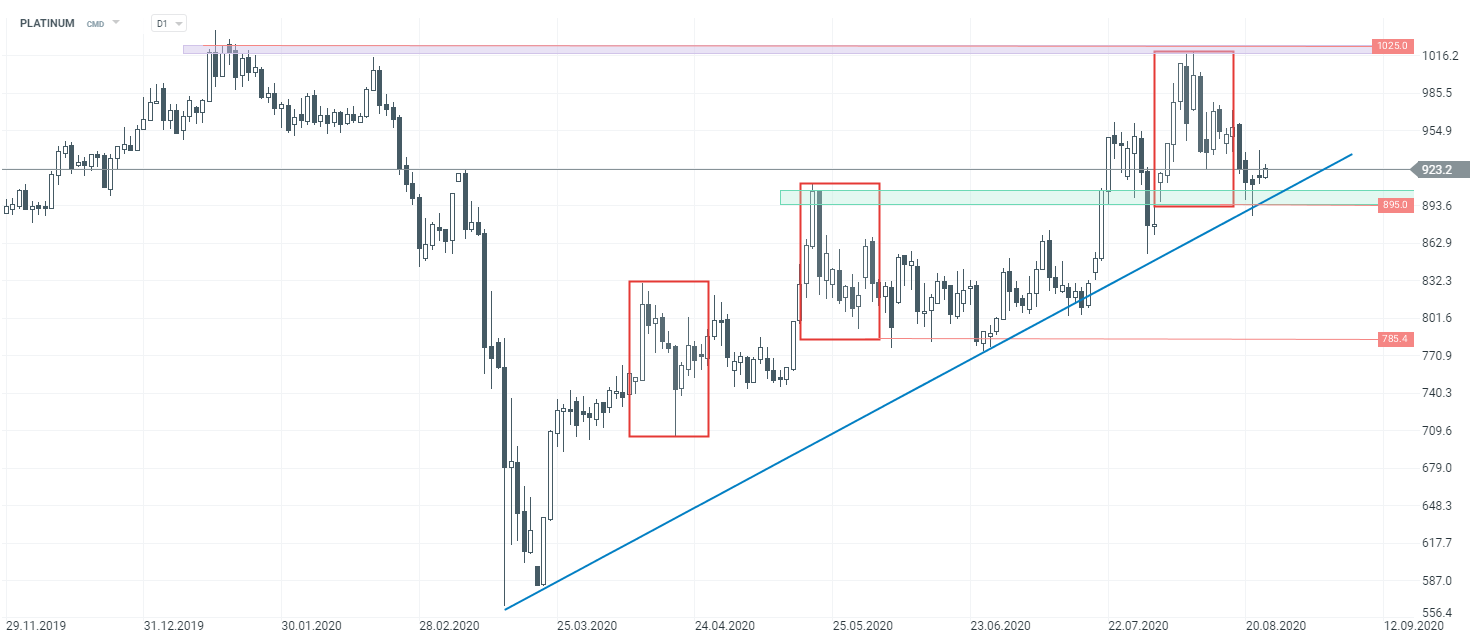 Platinum D1 interval. Source: xStation5

Daily Summary: The week ends on a positive note. SK Hynix up 14% on Nasdaq. Energy down (10.07.2026)

Three markets to watch next week (10.07.2026)

BREAKING: Iran and US are back at the negotiation table?! Oil takes a step back, stocks tick up!

Daily Wrap: Technology Leads Wall Street Higher. Markets Shrug Off US–Iran Tensions